.png)

-
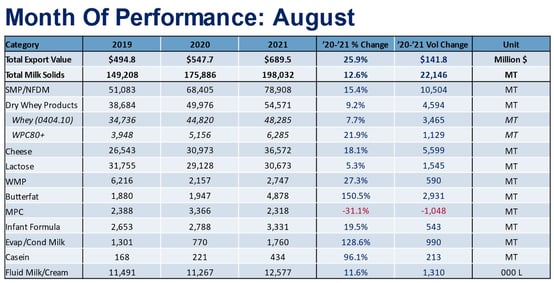
Solid growth in a diverse mix of destinations and products kept U.S. exports on a positive trajectory despite continued port congestion.
Export volume in milk solids equivalent grew by 13% in August compared to the same month a year ago, thanks to gains in every major product category. The largest gains were recorded by nonfat dry milk/skim milk powder (NFDM/SMP). Export value increased at twice the rate of volume (+26%), supported by a boom in cheese (+18%) and high-value whey (+22%) exports alongside a tighter global price environment.
More data and graphs from August's trade data can be found here.
Before we move into our analysis, we want to highlight our new and improved Data Hub for analyzing U.S. dairy export data. This interactive tool allows users to examine U.S. dairy exports by major product and region. The Data Hub also contains data on the major dairy importers, global prices and milk production of the major exporters. (Click on image below)
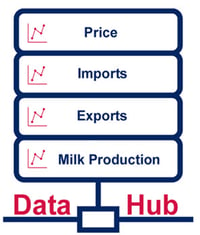
Without further ado, here are our main takeaways from August’s trade data:
Continued strength in cheese exports, particularly to Latin America – Stephen Cain
Historically, U.S. cheese exports tend to decline seasonally in the back half of the year. On average, exports in the second half have been 12% lower than in the first six months. However, the strong July and August numbers in 2021 have bucked that trend, with both months growing considerably.
Cheese exports in August increased 18% over the same period last year. Mexico was a crucial source of growth (as we’ll discuss below), but it was the rest of Latin America that impressed, growing 57% (+2,370 MT) year-over-year.
Chile and Colombia were the two leaders in South America, up 172% (+1,025 MT) and 68% (+177 MT). Exports to Central America and the Caribbean were up in nearly all markets but especially Panama (+89%, +387 MT), Honduras (+48%, +223 MT), Guatemala (+84%, +310 MT) and El Salvador (+142%, +136 MT). In general, the growth throughout Latin America has been supported by continued economic recovery as vaccine rates increase, economies reopen and demand rebounds for cheese.
Beyond the demand picture, port congestion continues to impact U.S. dairy exports. However, as most of the cheese leaving the U.S. destined for Latin America leaves the country via our land border with Mexico or through the Gulf, exporters are able to avoid the West Coast congestion. This ability has been a major advantage in circumventing congestion and has likely contributed to increased exports to the region. We will be watching closely as to whether this trend will continue in the coming months as logistics delays are not confined to California but are actively impacting Gulf ports as well.
U.S. price competitiveness has also likely been a factor in driving increased cheese exports. U.S. cheese prices have been sitting at a discount to New Zealand and the EU for much of the year. In the two months leading up to August, the U.S. was at a 22% discount to New Zealand and a 10% discount to the EU.
U.S. cheese exports for the rest of the year are anticipated to remain strong. Global demand for cheese is growing faster than normal with year-to-date global cheese trade up 6% (compared to the average annual growth rate of 3%). This global uptick in demand paired with U.S. product availability puts the U.S. in a strong position to see robust growth in cheese exports through the end of the year.
Mexico’s recovery powered August’s growth – William Loux
Focusing more specifically on our southern neighbor, exports to Mexico (+11,903 MT in milk solids equivalent) grew by more than twice the volume of any other market. However, while cheese powered the growth to the rest of Latin America, it was NFDM/SMP that was the primary engine for export growth to Mexico.
-Oct-05-2021-07-04-48-46-PM.jpg?width=1108&name=Chart5%20(2)-Oct-05-2021-07-04-48-46-PM.jpg)
Powder volumes to our southern neighbor increased by more than 40% compared to a year ago (+9,488 MT). Reportedly, economic difficulties and high feed costs limited the availability of local milk production in Mexico despite official statistics showing steady growth between 2 and 2.5%. Whether local milk is short or not, U.S. export figures suggest the market inside of Mexico is much tighter than it was a year ago. Prices are higher (in both dollar and peso terms), but, even so, import volumes of NFDM/SMP have consistently exceeded prior-year levels nearly every month this year.
Even more positive, the demand expansion was not limited to milk powders either. Exports of whey products jumped 68% (+1,559 MT) with growth of 60% or more in all whey codes (WPC, WPC80+, dry whey and modified whey). Although smaller volumes compared to ingredients, cheese was no laggard either (+9%, +777 MT).
With improved vaccination rates, a recovering economy and (maybe) lackluster domestic milk production, Mexico is returning to pre-pandemic import levels. On an annualized basis, Mexico is only 6% behind pre-pandemic demand in NFDM/SMP (compared to a low ebb of down 22%) and 9% in cheese (compared to a low ebb of down 16%). We expect this positive trend to continue even if import volumes are not quite up to 2019 totals by year end.
And it’s a good thing that Mexico’s demand has improved, because…
Port data showed minimal improvement in West Coast congestion
While exports to the Asia-Pacific markets benefited from a very slight improvement at West Coast ports in August, it’s hard to be overly enthused about it.
Looking at data from the major California ports (Los Angeles, Long Beach and Oakland), exporters (of all products, not just dairy) managed to secure passage for a few more loaded outbound containers in August (+9% compared to July).
However, filled containers loaded onto outbound vessels still lagged prior-year levels significantly (down 12%), despite plenty of demand for space aboard a ship. Indeed, consistent with July’s woes, 70% of outbound containers from California’s major ports lacked cargo.
-Oct-05-2021-05-43-07-94-PM.jpg?width=554&name=Chart3%20(2)-Oct-05-2021-05-43-07-94-PM.jpg)
The Pacific Northwest wasn’t much better with 57% of outbounds leaving Seattle-Tacoma empty – the second-highest percentage of empties and second-lowest amount of filled cargo exported since at least 2015 (when the data series begins); the record lows were just one month prior in July 2021.
So, while slightly more cargo moved in August out of the West Coast, shipping congestion remains an important storyline when assessing U.S. dairy exports. Effectively, the West Coast’s biggest export was air despite U.S. dairy and other exporters working tirelessly to find space aboard container vessels.
Looking ahead, with the holiday import rush already upon us, delays, high freight rates and difficulties securing cargo space will persist at least into the new year. So far, U.S. dairy companies have managed to grow exports despite the challenges, but it is worth pondering what our export figures would have been without these challenges.

Learn more about global dairy markets:-
Cheese and whey drive U.S. dairy exports to 6th straight month of growth
-
U.S. dairy exports on record pace through first half of 2021
-
Dairy exports show few signs of slowing in May
-
U.S. dairy exports maintain momentum in April
Subscribe to the U.S. Dairy Exporter Blog
The U.S. Dairy Export Council fosters collaborative industry partnerships with processors, trading companies and others to enhance global demand for U.S. dairy products and ingredients. USDEC is primarily supported by Dairy Management Inc. through the dairy farmer checkoff. How to republish this post.
-
