.png)

-
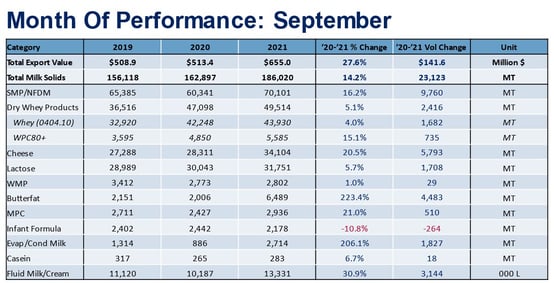
U.S. dairy export volume on a milk solids equivalent (MSE) basis climbed 14% in September with gains to most major markets and across products.
Nonfat dry milk/skim milk powder (NFDM/SMP) led the way with a 16% increase (+9,760 MT) followed by cheese (+20%, +5,793 MT) and butterfat (+223%, +4,483 MT). Whey and lactose exports also improved by 5% (+2,416 MT) and 6% (+1,708 MT), respectively.
More data and graphics from September's trade data can be found here.
Positively, dairy export value strengthened in September at nearly double the rate of volume, increasing 28% over the same month in 2020. Digging deeper into the value data, we have seen average export unit values steadily climb in 2021 due to both strengthening dairy prices and a higher percentage of U.S. dairy exports coming from higher-value products.
For instance, with regard to rising global prices, NFDM/SMP – the United States’ largest dairy export product – sold at an average export price of $1.30/lb in September, 23 cents higher than the same time last year. Looking ahead, that price remains well below current markets, so we should anticipate further growth in average export prices in the months ahead.
But the rising export value isn’t just a result of strengthening global prices. It’s also due to U.S. cheese exports climbing by 20%, WPC80+ exports expanding by 15%, and butterfat exports tripling – all are products that fetch relatively higher prices on the export market.
Put together, the average price for a pound of milk solids exported by the U.S. reached its highest point since 2015 with the potential to go higher in the months ahead.
Now, let’s turn our attention to the three markets we’ll be keeping a close eye on in the months ahead:
Mexico – Stephen Cain
U.S. dairy exports to Mexico have recovered in the past year. U.S. shipments to Mexico fell 15% (75,500 MT) overall in 2020, but rebounded by 19% (60,500 MT) so far in 2021. While this is encouraging, the improvement is partially due to favorable year-over-year comparisons. Compared to 2019 levels, U.S. exports to Mexico were still down 1% year-to-date – much better than 2020 but not quite to “new” growth.
The increased exports are likely being driven by a few factors: continued economic recovery, tighter domestic milk supply and product diverted to avoid congestion.
In terms of the Mexican economic recovery, Mexico’s GDP dropped 8.3% in 2020, but is forecasted to reach 6.2% growth in 2021 and 4% in 2022. This economic recovery is helping boost demand for dairy products both from Mexican residents and from tourists.
Another driver is milk production. While official statistics state continued growth, rumors among industry players in the country suggest a tighter market. Also supportive of a potentially tighter milk environment are trade statistics. While Mexico is not a major global player in dairy exports, it is a regional player, mainly supplying other countries in Latin America. Mexican exports continue to be depressed (down nearly 27% YTD), suggesting that domestic milk is needed to supply the local market with none leftover for the export market.
Lastly, continued port congestion (and port data suggests worsened in September) highlights Mexico as an alternative destination for U.S. exporters. While truck and rail rates are elevated alongside ocean rates, truck and rail provide an opportunity to avoid the port congestion now clogging all U.S. coasts. Utilizing truck and rail also allows for some increased level of reliability and generally a better opportunity for having product both leave the US and arrive at its destination on time. This is appealing to both exporters and importers and is leading to product that may have been originally destined for other markets being diverted to customers in Mexico.
All these factors are supportive of U.S. exports to Mexico, and we will likely see continued export momentum through the end of the year and into 2022.
Middle East-North Africa – Paul Rogers
U.S. milk solids exports to the Middle East-North Africa (MENA) region in the first three quarters of 2021 have already exceeded the entire 2020 calendar year total. But this is not just a single-year phenomenon.
U.S. suppliers have been rebuilding the business in MENA since the Russian dairy embargo in 2014 took away one of the largest EU dairy markets, forcing the bloc to re-channel its export efforts to other regions like the Middle East/North Africa. Uncompetitive U.S. butter pricing for most of 2014-2016 added to the problem.
The result: U.S. dairy shipments to MENA dropped off the cliff’s edge in 2015.
But we have been slowly and steadily earning back that MENA business ever since. U.S. dairy solids exports to MENA have now risen for five straight years. From 2016-2020, volume more than doubled to 78,494 MT MSE. Through three quarters of 2021, the United States shipped nearly 85,000 MT to the region.
-1.jpg?width=554&name=chart1%20(3)-1.jpg)
Butter, cheese, and NFDM/SMP fueled the increase, with September numbers continuing the longer term trend. U.S. butter exports to MENA soared 174% (+543 MT) in September, cheese increased 30% (+342 MT) and NFDM/SMP jumped 25% (+619 MT). Through three quarters, MENA accounted for 37% of total U.S. butterfat exports, with U.S. volume up 8,772 MT compared to the same period in 2020.
Strong sales gains to Bahrain (+4,855 MT) and Egypt (+2,815 MT) in the first three quarters led U.S. butter growth, while the UAE (+2,345 MT) and Saudi Arabia (+2,371 MT) led cheese. Algeria (+10,146 MT) and Egypt (+5,249 MT) fueled U.S. NFDM/SMP in the first three quarters.
We’ve also seen a healthy jump in U.S. whey shipments this year to MENA, with year-to-date volume up 41% (+1,167 MT).
Questions on continued growth revolve around recent halal certification issues in the region. (USDEC members can see the Member Alert “Egypt altering its Halal requirements” and Global Dairy eBrief, 10/8/21). In addition, the U.S. price advantage on NFDM/SMP and cheddar has narrowed in recent weeks.
However, crude oil prices recently reached a six-year high, supporting MENA economic growth and dairy demand in key oil-producing nations. Overall, a significant U.S. price advantage in butter and limited EU dairy supplies provide additional positive signs for continued U.S. export growth to the region in the fourth quarter and into 2022.
China – William Loux
It’s difficult to write a dairy market summary in 2021 without talking about China. China has been the driving force behind growing international demand for dairy products in 2021. Over the last 12 months of data, international dairy trade (from all suppliers, not just the U.S.) to China grew by 29% – equivalent to growth of more than 600,000 metric tons (MT) of milk solids (MSE). For context, no other market grew by more than 100,000 MT, and global trade to the rest of the world declined by 3%, or 225,966 MT MSE.
U.S. dairy exports to China have fared relatively well over the past year, climbing 51% year-to-date (+113,848 MT MSE) – though I should mention the usual caveats that 1) 2020 was a relatively low base and 2) outside of whey and lactose products, U.S. market share in China remains relatively small. September maintained this pattern – total U.S. exports gained 28% (+7,696 MT MSE) year-over-year.
Still, as we start to look to 2022, there are a couple of areas to watch closely.
First, U.S. low protein whey exports continue to slow month-to-month and will face steeper year-over-year comparisons in the 4th quarter and into 2022. Certainly, some of the slowdown can be attributed to congestion at west coast ports. However, the underlying demand fundamentals surrounding whey for feed use are worth watching closely as pork prices within China have fallen sharply alongside a steady rise in feed and other input costs. Together, that is likely to dampen the incentive for local pig farmers – a key customer for whey permeate and sweet whey – to expand production.
-Nov-04-2021-07-33-11-40-PM.jpg?width=554&name=chart2%20(3)-Nov-04-2021-07-33-11-40-PM.jpg)
Second, the U.S. has benefitted from the rise in China’s milk powder demand this year, more than doubling the United States’ exports of NFDM/SMP this year. However, after so much buying this year (global NFDM/SMP exports to China have climbed more than 100,000 MT in the last 12 months), we are hearing numerous reports that China is well stocked and thus unlikely to maintain its current buying pace. Additionally, U.S. market share remains small (just over 10%) and behind New Zealand, the European Union and Australia. So, if China purchases were to slow, the growth in U.S. exports to the country that we’ve seen in 2021 could slow as well as other suppliers, particularly Oceania, fight to maintain volumes.
.jpg?width=554&name=chart3%20(3).jpg)
Get more dairy trade data at USDEC's Data Hub

Learn more about global dairy markets:-
Seventh straight month of growth for U.S. dairy exports
-
Cheese and whey drive U.S. dairy exports to 6th straight month of growth
-
U.S. dairy exports on record pace through first half of 2021
-
Dairy exports show few signs of slowing in May
Subscribe to the U.S. Dairy Exporter Blog
The U.S. Dairy Export Council fosters collaborative industry partnerships with processors, trading companies and others to enhance global demand for U.S. dairy products and ingredients. USDEC is primarily supported by Dairy Management Inc. through the dairy farmer checkoff. How to republish this post.
-
