-
Eight signposts for U.S. dairy exports in 2020
By Alan Levitt and William Loux January 14, 2020- Tweet
Like signposts on a road, the U.S. Dairy Export Council anticipates these eight markers will guide global dairy markets this year.
Every January, the U.S. Dairy Export Council compiles a list of factors that are most likely to influence dairy trade in the year ahead. We call them our “signposts.”
These signposts are developments to expect and questions to be answered in 2020. Much like signposts on the road, we anticipate these eight markers will help guide the direction of global dairy markets and influence U.S. dairy export performance in 2020.
Our eight signposts for 2020:
Impact of USMCA and Japan trade deals (and further talks with Japan)
The implementation of a Phase 1 trade agreement between the United States and Japan on Jan. 1 and the impending implementation of the U.S.-Mexico-Canada Agreement (USMCA) both bode well for U.S. dairy export prospects in 2020 and beyond. This year we will get our first inklings of their benefits.
USMCA preserves our No. 1 market—Mexico—and its implementation should put to rest business uncertainty in that market over the past two years due to retaliatory tariffs, threats of border closure and worries over a unilateral withdrawal from the North American Free Trade Agreement.
It also has the potential to generate new business in Canada and, crucially, closes the loophole that allowed Canada to distort global milk powder trade for the past few years. That system, implemented in stages in late 2016 and early 2017, saw Canada’s skim milk powder (SMP) exports soar to an average of 68,000 metric tons in 2017 and 2018—nearly six times the average annual volume from 2011-2015—exacerbating what was already a depressed global SMP market. While Canada’s SMP exports are down 31% through the first 11 months of 2019, it is still shipping about 4,000 tons per month, compared to about 1,000 tons per month prior to 2016.
Across the Pacific, the U.S.-Japan Phase 1 trade agreement went into effect on Jan. 1, 2020, putting the U.S. on equal footing with Europe and New Zealand in terms of market access.
That is very good news given that U.S. suppliers have been operating at a disadvantage that would have only grown without the Phase 1 deal. Over the past year, the EU and Oceania enjoyed market access benefits via their respective trade deals with Japan: the EU-Japan Economic Partnership Agreement and the Comprehensive and Progressive Agreement for Trans-Pacific Partnership.
As noted in a Meros Consulting study commissioned by USDEC in early 2019, without a similar agreement, U.S. cheese exports could fall by 80% by 2027. Conversely, the study found that if the United States were on equal market access terms, U.S. cheese market share would rise from 13% in 2017 to 24% in 2027, with dollar sales tripling to more than $450 million.
That is significant since Japan is the largest cheese buyer in the world, importing about 300,000 tons in 2019, and forecasts suggest its appetite will continue to grow.
While Phase 1 of the U.S.-Japan agreement is a very welcome move in the right direction, a comprehensive U.S.-Japan trade deal remains essential for long-term U.S. competitiveness in that country. The U.S. Trade Representative’s Office previously stated that the administration would begin negotiations on Phase 2 around April and it remains imperative to follow through on those talks to build on the market access gains achieved in Phase 1.
Depleted EU intervention stocks, U.S. reclaiming share
For the first time since 2015, we are starting the year with zero SMP in EU intervention. That reflects a market in better balance. More importantly, it also means the EU will not be able to repeat its SMP export overachievement from 2018-19—and that spells opportunity for U.S. dairy suppliers.
Through the first 10 months of 2019, EU dairy suppliers exported 845,385 tons of SMP—172,451 tons more than January-October 2018. That’s a number that far exceeds any volume the EU has shipped in any previous January-October.
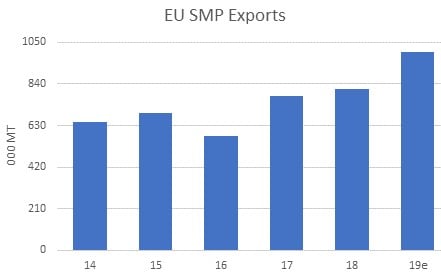
Intervention SMP stocks supported inflated EU SMP exports in 2018-19.
It was a gain made possible only through the dispersal of intervention stocks that had grown for over two years beginning in mid-2015 before slowly starting to decline at the start of 2018. Not coincidentally, EU intervention stocks were 175,805 tons at the end of 2018—almost matching that 172,451-ton increase through October.
In other words, EU SMP exports in 2019 are not at all reflective of what the EU will have to sell in 2020. In fact, we think EU exports this year could be down by more than 100,000 tons vs. last year.
USDEC expects U.S. suppliers should gain most of that business. Even if current SMP price levels take the edge off demand growth in some regions (see pricing signpost below), the United States is the only supplier capable of meeting that kind of volume.
Progress to resolve the U.S.-China trade war
This week, the United States and China are expected to sign Phase 1 of a trade agreement. The details of that agreement are still confidential. USDEC’s expectation is that U.S. Dairy’s voice has been heard by U.S. negotiators and that issues such as facilitating plant registrations, the importation of infant formula and defending common food names are included in the agreement. But the final product remains to be seen, as does China’s implementation follow-through and, critically, whether we will see a rollback of its damaging retaliatory tariffs on U.S dairy products.
Retaliatory tariffs contributed to U.S. dairy shipments to China falling 47% over the first 11 months of 2019
Tariff rollbacks would spark a welcome recovery in U.S. dairy exports to China. On a milk solids basis, U.S. dairy shipments to China fell 47% to 163,696 tons over the first 11 months of 2019, most of it due to lost whey and lactose sales. Not all of that stems from retaliatory tariffs (see African Swine Fever signpost below), but those tariffs have had, as USDEC President and CEO Tom Vilsack stated last year, “a profound impact” on U.S. dairy. The decline in U.S. shipments to China from January through November is roughly equal to 1.3% of total U.S. milk solids produced over that same period.
U.S. dairy suppliers worked hard in 2019 to open and expand new and alternative markets. And in an effort led by USDEC, U.S. exporters and their Chinese customers, China last fall granted a one-year exemption from retaliatory tariffs on U.S. whey permeate for animal feed. Both are positive signs moving into 2020, but real gains from the Phase 1 deal and real progress on Phase 2 would deliver a much bigger boost to U.S. dairy.
The status of African Swine Fever and Chinese herd recovery
The world lost more than a quarter of its pig population in 2019 to African Swine Fever (ASF). The largest losses came in China, but as of this writing, ASF had blanketed Vietnam and outbreaks were reported in Cambodia, Indonesia, Laos, the Philippines and Thailand. Further spread is a distinct possibility.
For the world’s whey suppliers, that meant a sharp decline in demand for feed-grade whey products in 2019. USDEC estimates total U.S. whey shipments will be down by about 120,000 metric tons in 2019. Almost all of that is due to China, where the one-two punch of ASF and retaliatory tariffs has pummeled U.S. sales.
China, however, may be turning the corner with the disease and USDEC expects the nation to begin restocking efforts in 2020.

USDEC President and CEO Tom Vilsack emphasized the benefits of using U.S. whey permeate in feed to rebuild the Chinese pig herd during his keynote address to the China Dairy Industry Association last year.
Demand for whey (and lactose) will hinge in part on the form those restocking efforts take and how successful they are. Large commercial operations are likely to lead (rather than small farms) and are also more likely to utilize dairy solids to support their efforts to restock, which would suggest even a partial restocking could lift demand. And with the feed whey exemption mentioned in the China signpost above, U.S. suppliers would assuredly play a large roll. (U.S. whey protein concentrate and modified whey exports to China increased 16% in November—their best performance of 2019—likely a function of that tariff exemption and a sign, we believe, of good things to come.)
USDEC expects Chinese overall whey and lactose demand to bottom out in 2020 (and global whey demand to begin recovering in the second half of 2020), with imports down another 5% before rebounding in 2021, even though the nation is unlikely to reach its pre-ASF herd size for several years.
China and Southeast Asia’s dairy appetites
Over the last four years, China and Southeast Asia accounted for more than three quarters of the growth in world dairy trade, so their buying habits are critical to dairy export growth.
.jpg?width=554&name=Southeast%20Asian%20kids-1-320893-edited%20(2).jpg)
Population increases are likely to fuel long-term dairy demand in China and SE Asia.
Chinese demand was solid in 2019. Imports through the first 11 months of 2019 were up 2%, even with the ASF-related drop in whey demand. Milk powder, China’s biggest import category, topped 800,000 metric tons in 2018, and 2019 volume was up 27% through November.
USDEC expects the country to increase dairy buying by around 2% in 2020, but sales could get off to a slow start in the first half and some potential developments that could impact demand bear watching:
- In 2019, for the first time since 2014, Chinese buyer stockpiles were reportedly higher at the end of the year than they were at the beginning.
- Domestic milk production rose about 2% last year and should do so again this year, providing solid gains in the domestic milk pool, even as more of that milk is used to make fresh products and less is dried.
- China’s 2020 GDP growth rate could fall below 6% for the first time in 30 years, according to some forecasts.
Nearby, Indonesia, Malaysia, the Philippines, Singapore and Thailand purchased a combined 756,000 metric tons of milk powder in the first 10 months of 2019, a record pace. Population and economic growth continue to fuel long-term demand growth projections.
But we are closely watching two factors:
- After running 20% higher in the first half, Southeast Asian milk powder imports fell 7% in July-October. Southeast Asia is one of the places where we might see more pushback on prices in 2020 (see pricing signpost below).
- The impact of ASF on whey demand.
Buyer (and consumer) willingness to spend more for dairy
International milk powder prices have risen into the range where international buyers traditionally begin to pull back.
Oceania whole milk powder (WMP) prices have had a difficult time staying above $3,200/ton for last five years. Not since 2013-2014, when China’s milk powder appetite sustained prices of up to $5,300/ton, have we seen numbers hold above $3,200/ton for very long. Buyers have balked and/or consumers have cut back as prices were passed down the distribution chain.
A $3,200/ton WMP price would put the ceiling for SMP at around $2,950/ton, based on the pre-intervention price relationship between WMP and SMP. Prices are already in that neighborhood in the face of tight global supply. It remains to be seen if buyers get anxious enough and have the willingness to push prices further.
.jpg?width=554&name=ingreds3%20(3).jpg)
International milk powder prices have risen. How high can they go in 2020?
Push-back is less of a factor for cheese and butter, because those prices are mostly driven by domestic demand in the EU and U.S. But the question is: Will the pattern of the past five years repeat for powder and will we see a price-driven demand pullback?
Milk production is coming back, but growth will still be modest
Improved prices and better margins should lead U.S. and EU milk production to register their largest volume gains since 2017. But that doesn’t mean we expect to see a milk surplus.
USDEC forecasts aggregate production from the world’s top five dairy suppliers—Argentina, Australia, the EU, New Zealand and the U.S.—to rise only about 1% in 2020 (adjusting for Leap Day).
.png?width=554&name=milk%20production2%20(4).png)
Milk production from the world’s largest dairy suppliers is rising but at a manageable pace.
Both EU and New Zealand dairy farmers are facing increasingly stringent environmental regulations, complicating expansion. In addition, New Zealand cow numbers have declined for three straight years, making the country reliant on yield improvement for milk output growth. And EU milk production growth leaders from 2019—when Ireland, Poland and the UK all put up banner years—should settle back down to earth in 2020.
Australia continues to struggle with high production costs brought on by drought, and at press time, recent bush fires were encroaching on major dairy production regions. Milk production there is tracking to decline to levels not seen for more than two decades. And economic troubles (including high inflation eating into farmer payouts) are deterring milk output in Argentina.
In recent years, global demand growth has supported milk production growth from the major exporters of about 1.5%, year over year. When production growth is above 1.5% we have too much milk. Below 1.5%, as should be the case in 2020, the market is in better balance.
Global economic growth and geopolitical flare-ups
The good news is that the global economy is likely to match or slightly exceed 2019 growth in 2020. The bad news is that 2019 global economic growth is what the Organization for Economic Cooperation and Development (OECD) calls “weak.”
.jpg?width=544&name=growth%20(2).jpg)
Expanding middle classes in emerging markets drive global dairy demand growth.
The World Bank notes economic risks are “firmly on the downside.” OECD, World Bank, International Monetary Fund and others point to some combination of heightened trade tensions, hotspots of social and political instability, subdued investment and other factors as the cause.
Oil prices—critical to dairy demand in much of the Middle East, North Africa and other oil-producing regions—started 2019 with a rally but then yo-yoed between $53 and $63/barrel the rest of the year, well down from 2018 highs of $75/barrel.
The expanding middle class in emerging markets is one of the pillars of global dairy demand growth, so an economic slowdown that hits middle class buying power and development would likely hinder export gains.
Alan Levitt is USDEC's vice president of market analysis. William Loux is a global trade analyst at USDEC.
- 6 new infographics show what USMCA does for the U.S. dairy industry
- Vilsack: Agreement makes USMCA "even better deal" for U.S. dairy industry
- Vilsack optimistic about dairy exports in 2020
- 5 compelling economic facts about U.S. dairy exports to Mexico (charts)
- Vilsack lists reasons for U.S. dairy farmers to smile about the future of exports
- How the spread of African swine fever to Asia's pigs may affect U.S. dairy exports
- 7 USDEC strategies opening doors in China and Japan for U.S. dairy farmers
- Vilsack optimistic about exports after China, Japan trips
Subscribe to the U.S. Dairy Exporter Blog
The U.S. Dairy Export Council fosters collaborative industry partnerships with processors, trading companies and others to enhance global demand for U.S. dairy products and ingredients. USDEC is primarily supported by Dairy Management Inc. through the dairy farmer checkoff. How to republish this post.
10 Most Recent Posts
Most Popular Posts in Past Year
Index of Posts by Topic
- #GotDairyJobs (4)
- About USDEC (67)
- Africa (6)
- Australia (4)
- Blog (8)
- Brazil (4)
- Canada (20)
- Central America (1)
- Cheese (58)
- Chile (1)
- China (54)
- Common food names (7)
- Company News (20)
- Consistent Supply (1)
- Crisis Management (3)
- Cuba (2)
- Dairy (6)
- Dairy checkoff (9)
- Dairy Ingredients (5)
- Dairy Management Inc. (2)
- Dairy Resources (1)
- Dairy Supply Chain (1)
- Dairy Trends (5)
- Documentation (3)
- EU (24)
- Experts on Dairy Exports (4)
- Exporter of the Year (2)
- Exports (24)
- Farmer leaders (1)
- Farming (38)
- Food Aid (8)
- Food Safety (8)
- Foodservice (3)
- Free trade agreements (34)
- Future trends (1)
- Geographical Indications (GIs) (10)
- Global Marketing (86)
- Global Shipping Crisis (1)
- Got Jobs? (9)
- Indonesia (1)
- Innovation (17)
- Japan (17)
- Krysta Harden (1)
- Market Access (25)
- Market Conditions (271)
- Member Services (17)
- Mexico (41)
- Middle East (9)
- Middle East & North Africa (3)
- Middle East/North Africa (9)
- Milk (4)
- Milk Protein Concentrate (MPC) (2)
- New Zealand (11)
- Next5% (20)
- Nonfat Dry Milk/Skim Milk Powder (8)
- Nutrition (19)
- Product Innovation (6)
- Protein (4)
- Regulations (5)
- Research & Data (329)
- Russia (3)
- Singapore (10)
- South America (8)
- South Korea (10)
- Southeast Asia (25)
- Strategic Insights (1)
- Supply (1)
- Sustainability (26)
- Technology (2)
- ThinkUSADairy (5)
- TPM23 (1)
- TPP (13)
- Traceability (8)
- Trade Barriers (5)
- Trade Data (7)
- Trade Policy (72)
- TTIP (5)
- UHT Milk (7)
- USMCA (2)
- Vietnam (4)
- Whey (6)
- Whey Ingredients (2)
- Whey products (10)
- Whole Milk Powder (WMP) (3)
- World Dairy Expo (1)
- World Milk Day (1)
- Yogurt (1)
Index of Posts by Date, Author
- June 2021 (13)
- March 2015 (12)
- September 2015 (12)
- April 2015 (11)
- December 2015 (11)
- March 2014 (10)
- February 2015 (10)
- October 2015 (10)
- October 2014 (9)
- June 2015 (9)
- July 2015 (9)
- November 2015 (9)
- March 2016 (9)
- October 2019 (9)
- September 2013 (8)
- May 2015 (8)
- August 2015 (8)
- January 2016 (8)
- February 2016 (8)
- March 2017 (8)
- December 2018 (8)
- May 2019 (8)
- December 2019 (8)
- June 2014 (7)
- November 2016 (7)
- May 2017 (7)
- May 2018 (7)
- July 2020 (7)
- June 2023 (7)
- July 2016 (6)
- August 2018 (6)
- October 2018 (6)
- November 2018 (6)
- February 2019 (6)
- June 2019 (6)
- August 2019 (6)
- March 2020 (6)
- April 2020 (6)
- June 2020 (6)
- June 2022 (6)
- February 2014 (5)
- June 2016 (5)
- August 2016 (5)
- September 2016 (5)
- December 2016 (5)
- February 2017 (5)
- July 2017 (5)
- October 2017 (5)
- January 2018 (5)
- April 2018 (5)
- June 2018 (5)
- July 2018 (5)
- September 2018 (5)
- January 2019 (5)
- March 2019 (5)
- April 2019 (5)
- July 2019 (5)
- September 2019 (5)
- November 2019 (5)
- January 2020 (5)
- August 2020 (5)
- October 2020 (5)
- April 2021 (5)
- January 2022 (5)
- May 2013 (4)
- September 2014 (4)
- April 2016 (4)
- May 2016 (4)
- October 2016 (4)
- January 2017 (4)
- April 2017 (4)
- June 2017 (4)
- August 2017 (4)
- September 2017 (4)
- December 2017 (4)
- February 2018 (4)
- February 2020 (4)
- May 2020 (4)
- February 2022 (4)
- September 2022 (4)
- April 2023 (4)
- December 2023 (4)
- November 2017 (3)
- March 2018 (3)
- September 2020 (3)
- December 2020 (3)
- February 2021 (3)
- May 2021 (3)
- August 2021 (3)
- December 2021 (3)
- March 2022 (3)
- April 2022 (3)
- May 2022 (3)
- October 2022 (3)
- December 2022 (3)
- May 2023 (3)
- July 2023 (3)
- November 2023 (3)
- January 2026 (3)
- March 2011 (2)
- June 2011 (2)
- September 2011 (2)
- March 2012 (2)
- June 2012 (2)
- July 2012 (2)
- March 2013 (2)
- July 2013 (2)
- November 2020 (2)
- January 2021 (2)
- March 2021 (2)
- July 2021 (2)
- September 2021 (2)
- October 2021 (2)
- November 2021 (2)
- July 2022 (2)
- August 2022 (2)
- January 2023 (2)
- March 2023 (2)
- October 2023 (2)
- January 2024 (2)
- February 2024 (2)
- April 2024 (2)
- June 2024 (2)
- July 2024 (2)
- November 2024 (2)
- December 2024 (2)
- February 2025 (2)
- June 2025 (2)
- July 2025 (2)
- September 2025 (2)
- November 2025 (2)
- December 2025 (2)
- January 2010 (1)
- February 2010 (1)
- March 2010 (1)
- April 2010 (1)
- May 2010 (1)
- June 2010 (1)
- July 2010 (1)
- August 2010 (1)
- September 2010 (1)
- October 2010 (1)
- November 2010 (1)
- December 2010 (1)
- January 2011 (1)
- February 2011 (1)
- April 2011 (1)
- May 2011 (1)
- July 2011 (1)
- August 2011 (1)
- October 2011 (1)
- November 2011 (1)
- December 2011 (1)
- January 2012 (1)
- February 2012 (1)
- April 2012 (1)
- August 2012 (1)
- September 2012 (1)
- October 2012 (1)
- November 2012 (1)
- December 2012 (1)
- January 2013 (1)
- February 2013 (1)
- April 2013 (1)
- June 2013 (1)
- August 2013 (1)
- October 2013 (1)
- November 2013 (1)
- December 2013 (1)
- January 2014 (1)
- April 2014 (1)
- May 2014 (1)
- November 2022 (1)
- February 2023 (1)
- August 2023 (1)
- September 2023 (1)
- March 2024 (1)
- May 2024 (1)
- August 2024 (1)
- September 2024 (1)
- October 2024 (1)
- January 2025 (1)
- March 2025 (1)
- April 2025 (1)
- May 2025 (1)
- August 2025 (1)
- February 2026 (1)
- USDEC (183)
- USDEC Staff (167)
- Alan Levitt (119)
- Tom Suber (41)
- Margaret Speich (22)
- Marc A.H. Beck (15)
- Vikki Nicholson-West (11)
- Angélique Hollister (11)
- Tom Vilsack (8)
- Jaime Castaneda (7)
- Matt McKnight (7)
- Véronique Lagrange (7)
- Margaret Speich and Mark O'Keefe (7)
- Ross Christieson (7)
- Paul Rogers (6)
- Shawna Morris (5)
- William Loux (5)
- Alan Levitt and Marc Beck (5)
- Krysta Harden (4)
- USDEC Communications (3)
- Kristi Saitama (3)
- Marilyn Hershey (3)
- Brad Gehrke (3)
- Tom Quaife (2)
- Nick Gardner (2)
- Jim Mulhern (2)
- Alan Levitt and William Loux (2)
- Kara McDonald (2)
- Luke Waring (2)
- Merle McNeil (2)
- Krysta Harden, USDEC President and CEO (2)
- Andrei Mikhalevsky (1)
- Rodrigo Fernandez (1)
- Dermot Carey (1)
- Jeremy Travis (1)
- Annie Bienvenue (1)
- Ross Christieson and Shawna Morris (1)
- Becky Nyman (1)
- Paul Rogers and Tom Quaife (1)
- Rick Ortman (1)
- Tony Rice (1)
- Barbara O’Brien (1)
- Paul Rogers and Mark O'Keefe (1)
- Dalilah Ghazalay (1)
- Amy Wagner (1)
- Mitchell Bowling (1)
- Erica Louder (1)
- Brad Scott (1)
- Amy Foor (1)
- Scott Lantz (1)
- Sandra Benson (1)
- Errico Auricchio (1)
- Jaclyn Krymowski (1)
.png)

