.png)

-
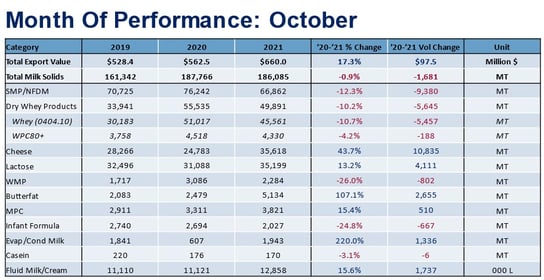
Strong U.S. cheese and butterfat exports fall short of offsetting declines in milk powder and whey, leading to 1% drop in overall volume.
In October, vibrant global cheese demand lifted year-over-year U.S. cheese exports by 44%, with gains to nearly every major region. October U.S. butterfat shipments more than doubled, compared to the previous year, led by the Middle East/North Africa (MENA) and Canada, which have been driving U.S. butterfat sales most of the year. This continued strength on the fats side of the portfolio helped mitigate reduced shipments of milk powder -12% (-9,380 MT) and whey -9% (-5,645 MT), but could not totally offset them.
More data and graphs from October's trade data can be found here.
Total U.S. dairy exports (milk solids equivalent or MSE) fell 1% in October. It was the first monthly decline in MSE since January.
Overall, year-over-year U.S. performance suffered from a combination of unusually high volume of exports in October of 2020 and the ongoing port crisis (see more analysis of the port situation below).
Despite the slight decline in MSE volume, U.S. export value increased – continuing the year-long strengthening trend. Export value in October was up 17% over the same month last year; a very positive sign given the decrease in volume. This is reflective of both rising global prices and increasing U.S. exports of higher-value products like cheese (+44%, +10,835MT) and butterfat (+107%, +2,655 MT), which comparatively pull higher prices in the export market.
Through October, total U.S. dairy exports (MSE) were up 11% and remain on record pace. Value was up 17% to $6.48 billion for the same period, also a record pace.
For even more data, check out our new and improved USDEC Data Hub for analyzing U.S. dairy export data. This interactive tool allows users to examine U.S. dairy exports by major product and region. The Data Hub also contains data on the major dairy importers, global prices and milk production from major exporters.

Here are our main takeaways from October’s trade data:
Butterfat Exports Continue to Boost Volume and Value of U.S. Dairy Exports – Stephen Cain
Butterfat exports in October more than doubled (+107%, +2,655 MT) over the same period last year. The strong increase in both butter and cheese exports helped keep overall MSE volume from declining more than 1% and supported the growth in overall export value in October.
The leading destinations for U.S. butterfat exports in October were Canada (+118%, +1,061 MT) and the Middle East-North Africa (MENA) (+63%, +564 MT). Exports to Japan (+106 MT, up from zero last year) and Korea (up nearly four-fold to 347 MT) also saw significant gains.
Despite the freight advantage to Canada, the U.S. competes with New Zealand in butterfat exports there, largely trading market-share dominance. However, as New Zealand has focused its product offerings to meet Chinese demand in WMP and has had a lackluster start to its milking season, less fat has been available for butterfat production, leaving less available for exports and raising NZ prices. This has contributed to improved U.S. competitiveness. Over the last 12 months, U.S. butterfat has run at a 23% discount to New Zealand and currently sits at a 21% discount. The U.S. has capitalized and exported more butterfat to Canada this year than any other year in the last decade. It is worth noting that most of the volume to Canada goes in under Canada’s Import for Re-Export Program so it is not necessarily reflective of internal Canadian demand – which remains heavily protected.
More importantly, U.S. butterfat exports to MENA are also at the highest levels they have been at in years, and the U.S. has climbed back to an 11% market share in the region, up from 1% in early 2020. The U.S. has largely taken market share from the EU+UK, which saw its share decline from 59% market in early 2020 to 44% currently.
The major contributors to increased U.S. exports to the region are U.S. price competitiveness and the EU27+UK’s struggling milk production. Overall EU27+UK milk production this year may potentially decline, and the big three producers of Germany, France and the UK have all faltered. In the face of limited milk supply, the EU has prioritized cheese production, leaving less milk available for butterfat production, which in turn has tightened the market and pushed prices higher. Over the last 12 months, U.S. butterfat was priced at a 20% discount to the EU27+UK and currently sits at a 27% discount. Both of these factors have contributed to increased U.S. butterfat exports to MENA.
Price competitiveness and struggling competitor milk production have helped bolster U.S. butterfat exports this year, and the October data reflects that continuing trend. We expect butterfat exports to remain strong through the end of the year.
U.S. Cheese Extends Winning Streak – Paul Rogers
U.S. cheese exports grew 44% in October (+10,835 MT compared to the previous year to 35,618 MT). It was the most cheese the U.S. ever shipped in October—marking the fourth month in a row in which U.S. suppliers set a monthly record.
U.S. gains were broad-based with significant gains in nearly every key market: Mexico +61%, +2,974 MT; South Korea +46%, +2,056 MT; Australia +138%, +1,641 MT; Central America, +61%, +1,428 MT; and Japan +71%, +1,408 MT.
The gain to South Korea was particularly welcome given that year-over-year U.S. cheese exports to the nation, our No. 2 market, were off 25% from May-September. In addition, it was the fourth straight month of year-over-year growth to our No. 1 market Mexico, as cheese demand continued to recover from the double blow of recession and pandemic in 2020 (U.S. cheese shipments to Mexico were up 9% through the first 10 months of the year).
Overall, global cheese demand remains strong. The category led total global dairy trade volume growth in September, driven by the improved COVID-19 outlook (at the time) and reopened and rebounding tourism and foodservice industries (see USDEC’s September International Demand Analysis for more). The question moving forward is how much the Omicron variant will impact worldwide restaurant operations from the standpoint of mandated closures, fewer tourists or reduced business hours, as well as cautious consumers stepping back from foodservice as the world awaits more data on the variant.
U.S. suppliers remain well-positioned to satisfy demand growth, with ample supply and an ongoing price advantage over New Zealand and the EU.
Port Data Shows Exports Hampered by Empties and Reduced Efficiency – William Loux
Putting aside the dairy-specific data and looking at the broader port situation, the latest data showed that port efficiency deteriorated heading into the final two months of the year.
For much of this year, we have talked about how carrier companies were choosing to load empty containers onto their vessels rather than containers filled with agricultural products, including dairy. That remained true in October: 68% of all containers exported out of the Ports of Los Angeles, Long Beach, Oakland and Seattle-Tacoma were empty. Even though the percentage of empties was a small improvement from September, it still sits 6 percentage points higher than October 2020 and 14 points higher than October 2019.
-Dec-07-2021-08-32-24-85-PM.jpg?width=544&name=Chart2%20(2)-Dec-07-2021-08-32-24-85-PM.jpg)
Unfortunately, this problem was exacerbated by reduced efficiency at the major West Coast ports. Fundamentally, the major West Coast ports processed fewer containers (of all types) in October, likely because of challenges with securing trucking to move imported containers, equipment shortages and lack of available space at port to offload imported products.
To put some data behind the analysis, on a daily basis in October, the major West Coast ports processed the fewest inbound containers since January and 80,000 fewer containers than October of last year. The story was similar with outbound containers as well (regardless of whether they were loaded or empty).
-Dec-07-2021-08-34-07-48-PM.jpg?width=544&name=Chart3%20(2)-Dec-07-2021-08-34-07-48-PM.jpg)
What that means is: in the midst of a historic import surge in October, fewer ships were successfully offloaded. That reduced turnaround time then translated to fewer opportunities for U.S. dairy exporters to secure passage while carrier companies opted for empty containers over containers filled with U.S. dairy products.
Although not revelatory – as this data confirms the anecdotes U.S. dairy exporters have been telling us for months – the data casts additional clarity onto the significant challenges facing U.S. dairy exporters. Thus, the fact that the U.S. remains on pace for a record year in volume, value and percent of production speaks to the resilience and creativity of U.S. dairy to ensure that customers receive their product.
Gratefully, not all is doom and gloom in the months ahead. Spot shipping rates from Asia to the United States have started to decline, and we are seeing the backlog of ships waiting outside the major California ports starting to shrink (albeit slowly, once you account for the change in how L.A.-Long Beach calculates docked ships). Both factors are leading indicators to suggest that (hopefully) the worst of the holiday import surge is over (at least on the water, if not inland quite yet). If so, that should ease congestion at ports and enable exporters to secure passage onboard carrier vessels.
Still, policy changes will likely be necessary to clear the backlog of ships and ensure exporters don’t find themselves in the same position next holiday season.
Learn more about global dairy markets:
-
Increases across the board keep U.S. dairy exports on pace for another record year
-
Seventh straight month of growth for U.S. dairy exports
-
Cheese and whey drive U.S. dairy exports to 6th straight month of growth
-
U.S. dairy exports on record pace through first half of 2021
Subscribe to the U.S. Dairy Exporter Blog
The U.S. Dairy Export Council fosters collaborative industry partnerships with processors, trading companies and others to enhance global demand for U.S. dairy products and ingredients. USDEC is primarily supported by Dairy Management Inc. through the dairy farmer checkoff. How to republish this post.
-
