.png)

-
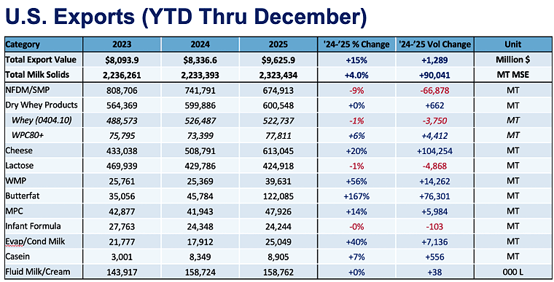
Year-end volume and value second only to 2022.
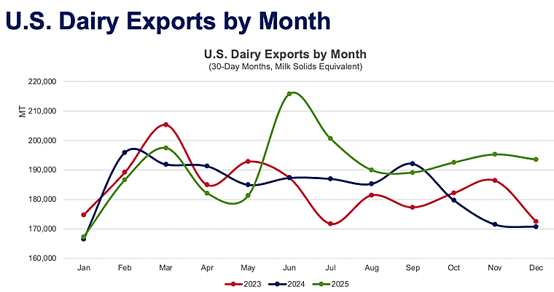
U.S. dairy exports finished 2025 with a flourish, as year-over-year (YOY) milk solids equivalent (MSE) volume rose 13% in December, raising annual growth for the year to 4%. Total MSE volume of 2.32 million MT was the second highest of all time, after 2.41 million MT in 2022.
U.S. export value for the year rose 15% to $9.63 billion, just shy of the 2022 record of $9.66 billion.
December trends were largely consistent with previous months with stellar cheese and butterfat sales driving overall volume. YOY December cheese exports climbed 24% (+10,482 MT), led by record monthly volume to Mexico—19,656 MT, a gain of 15% over the same month the previous year—and steady growth to South Korea (+59%) and Australia (+68%).
Butterfat had its biggest month of the year in December: 15,706 MT. YOY volume increased 260% (+11,345 MT), with butter up 261% (+7,621 MT) and AMF and spreads up 258% (+3,724 MT).
U.S. suppliers continued to ship to more traditional butter customers like Canada in December (+64% YOY, +1,059 MT) while continuing to build relationships with “new” buyers, which has been a hallmark of 2025. North Africa, Australia and Bahrain bought zero U.S. butter in December 2024. In December 2025, U.S. suppliers shipped 2,054 MT to North Africa, 1,344 MT to Bahrain, and 816 to Australia.
December was also helped by nonfat dry milk/skim milk powder (NFDM/SMP), a rarity in 2025. NFDM/SMP broke out of the doldrums and rose 18% (+8,980 MT) year-over-year, driven by gains to Southeast Asia (+53%, +5,679 MT).
However, while welcome, the nonfat increase is due in part to low prior-year volume—only 49,938 MT in December 2024, which, at the time, was the first month of sub-50,000 MT in over five years. Two more sub-50,000 MT months followed in January and February 2025, setting the U.S. up a potential good start percentage-wise for U.S. NFDM/SMP in 2026.
What follows is a product-by-product look at 2025.
For more detailed information, as well as interactive charts and data, visit USDEC's Data Hub.
A dream year for cheese exports
Things couldn’t have gone much better for U.S. cheese exports in 2025, as suppliers demolished the previous record for annual exports. Year-over-year shipments surged 20% (+102,763 MT) to 613,045 MT. YOY volume increased in 11 of 12 months, with only March failing to beat the prior year. Even then, March boasted a healthy total of 49,287 MT, just 1% back on the previous year, which, at the time, was the U.S. record for cheese shipments in a month. Every month from May through the end of the year exceeded 50,000 MT.U.S. cheesemakers investments in new capacity delivered immediate dividends, as cheddar exports led the way, rising 63% (+43,788 MT). Better-than-expected economic growth in key export markets, global consumers’ ever-growing familiarity with cheese flavors and uses (incorporated into local diets and eaten in Western dishes) helped fuel demand. One of the most impressive aspects in 2025 was the geographic spread of sales. The United States exported more than 1,000 MT of cheese to 37 countries in 2024. In 2025, U.S. cheese exports grew to 32 of those 37. Plus, two new countries became 1,000 MT+ buyers. Looking toward 2026, U.S. cheese suppliers have set themselves a high bar.
A banner year for butterfat
2025 was a banner year for U.S. butter and anhydrous milkfat (AMF) trade as exports surged to 122,085 MT (+167%, +76,301 MT), handily besting the prior record set in 2013 by a margin of 31,655 MT (+35%). Both butter (+163%, +51,726 MT) and AMF (+176%, +24,574 MT) played a role in pushing the butterfat volume to the highest level ever witnessed. Ample availability combined with competitive pricing compared to alternative global suppliers during the year helped to spur U.S. butterfat exports upward to nearly every destination, though volumes to MENA were nearly 17 times larger than during the prior year. This increase complemented other sizeable gains in Europe and Canada. With milkfat production continuing to advance, exports have overcome historical barriers to trade and played a critical role in preventing excess accumulation of butter inventories that could have put even further downward pressure on prices. With no indication that milkfat production in the U.S. will abate, exports are likely to continue to play this important market balancing function into the future.A rollercoaster year for low-protein whey
U.S. exports of low protein whey experienced a volatile 2025 with enormous fluctuations due to rapidly shifting trade policy early in the year. When the dust settled, total shipments of whey under the 040410 heading were nearly on par with prior-year levels, down just 0.7% (-3,671 MT). This steadiness, however, belies the vast differences that materialized across the subheadings. Shipments of dry whey jumped by a sizeable 9% (+17,674 MT) due to improved demand from China and South America. Further adding to the positive momentum was modified whey, which grew 8% (+13,378 MT) due to a stronger pull from Asia and Mexico. However, these gains were canceled out by a 23% (-34,802 MT) drop in exports of whey protein concentrates with less than 80% protein—perhaps not a surprising result considering that output of these products has shrunk as manufacturers pivot toward producing more lucrative, higher value ingredients.Health and wellness drives high-protein whey
Despite losing momentum in the final months of the year, a strong performance in mid-2025 delivered a positive result for U.S. exports of WPC80+, which grew 6% (+4,412 MT) versus prior year. A record large 77,811 MT of U.S. high protein whey moved offshore during the year, besting the prior record set in 2023 by 2,016 MT (+3%). Chinese demand for high protein whey faltered dramatically (-45%, -7,117 MT) in 2025 though an uptick in the appetite in Japan (+32%, +4,065 MT) and Europe (+44%, +3,098 MT) helped to compensate for the loss. A seemingly insatiable worldwide demand for protein due to health and wellness associations bodes well for continued strength in WPC80+ trade. However, with prices at eye watering highs and surging domestic demand absorbing growing output, powerful competitive forces will exert significant pressure on the market in the months ahead.Production hamstrings U.S. NFDM/SMP growth
U.S. NFDM/SMP exports faltered in 2025, falling 9% (-66,878 MT). For the second straight year, lagging U.S. exportable supply constrained U.S. suppliers’ competitiveness. U.S. NFDM production fell 1% in 2025 while SMP slumped 19%, and those declines followed 11% and 21% drops, respectively, in 2024. The lower U.S. profile was compounded by lagging demand from the two largest U.S. markets—Mexico and Southeast Asia—which account for more than 80% of U.S. nonfat exports. For both regions, purchasing shifted significantly during the front and back of the year. U.S. exports to Mexico rose 4% (+7,651 MT) in the first half of 2025 and dropped 12% (-24,256 MT) in the second half. Southeast Asia was generally the opposite: U.S. NFDM/SMP exports fell 26% (-45,792 MT) in the first three quarters of the year, but increased 28% (+10,357) in the fourth quarter. Overall Southeast Asian dairy purchasing from all sources began to improve toward the end of 2025, offering hope for a complete rebound this year.*In order to correct for reporting inconsistencies (made clear by suspiciously low high-protein whey prices to China) and provide a more realistic picture of product flows, USDEC adjusts official whey export data, aligning reported unit values with actual market prices. If you have any questions or would like more information, don’t hesitate to reach out to any member of the Economics team.
Learn more about global dairy markets-
U.S. dairy exports poised for strong finish to 2025
- October U.S. dairy exports jump 7%
-
U.S. dairy export volume up 1.7% through three quarters
-
August exports continue growth streak, rise 3%
Subscribe to the U.S. Dairy Exporter Blog
The U.S. Dairy Export Council fosters collaborative industry partnerships with processors, trading companies and others to enhance global demand for U.S. dairy products and ingredients. USDEC is primarily supported by Dairy Management Inc. through the dairy farmer checkoff. How to republish this post.
-
