.png)

-
September decline cuts into year-to-date growth, despite ongoing strength in U.S. cheese, butterfat and other products.
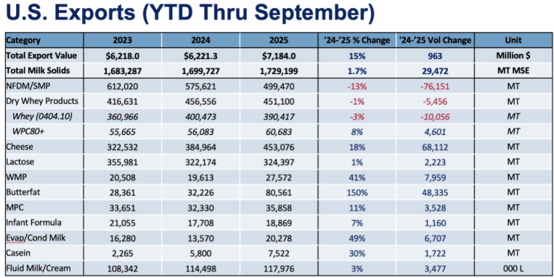
The United States’ three-month U.S. dairy export growth streak came to an end in September, as export volume fell 2% in terms of milk solids equivalent (MSE). The decline came despite impressive growth in cheese and butterfat, as well as gains in lower-volume categories such as high-protein whey (WPC80+), milk protein concentrate (MPC) and whole milk powder (WMP).
Note: September trade data usually comes out the first week of November but was delayed this year due to the government shutdown. The release dates for subsequent 2025 monthly trade data are unknown at this point.
In many ways, September was consistent with recent trends: cheese sales setting new monthly records, butterfat soaring, and WPC80+ steadily gaining volume, while nonfat dry milk/skim milk powder (NFDM/SMP) languished. The biggest difference that pulled September into the red was a 5% decline (-2,148 MT) in U.S. lactose shipments (after rising 9% over the previous three months) and a 12% drop-off (-5,856MT) in low-protein whey (after rising 8% the previous three months).
Despite the overall September decline, U.S. dairy exports were up 1.7% year-to-date through the first three quarters. Over the same period, U.S. dairy export value grew 15% to $7.184 billion, which includes a YOY September increase of 9% to $781.0 million.
High points
The U.S. cheese export wave rolled on in September. YOY volume increased 35% (+13,570 MT) putting YTD volume at 453,076 MT. Among widespread gains, the month featured a big rebound in sales to Mexico. YOY cheese shipments to Mexico jumped 23% (+3,446 MT) in September to 18,209 MT. It was the best month for U.S. cheese sales to the country since May 2024.On the whole, over the past nine months, U.S. suppliers have already shipped more cheese to foreign markets than they have in any full calendar year, with the exception of 2024. That 2024 record (510,282 MT) will fall when November data arrives. In fact, while a lot can change in one quarter, U.S. cheese exports have a chance to top 600,000 MT in 2025.
Beyond cheese, YOY U.S. butterfat exports (butter and anhydrous milkfat) doubled to 8,817 MT in September. Backed by favorable pricing, U.S. suppliers made further progress diversifying their market reach in September. As sales to traditional customer Canada slipped 7% for the month (-176 MT), the United States saw exponential growth to The Netherlands (+1,636 MT), Australia (+1,278 MT) and Saudi Arabia (+1,040 MT).
Through three quarters, U.S. butterfat sales soared 149% to 80,561 MT. In value terms, U.S. butter exports were almost $400 million through the first nine months of 2025. To put that in perspective, we have already passed the highest-value U.S. butter exports ever achieved in a full year: $351 million in 2013.
Low points
A combination of reduced U.S. supply and tepid global demand continued to undercut U.S. NFDM/SMP exports in September. U.S. volume dropped 19% (-11,491 MT).The top two U.S. buyers—Mexico and Southeast Asia—posted YOY declines of 17% and 21%, respectively, in September. In the third quarter, shipments to Mexico fell 13% (-13,445 MT) and YTD were off 2% (-5,795 MT). As for Southeast Asia, U.S. YOY shipments of NFDM/SMP to the region have not grown since May. For the four months through September, U.S. volume dropped 19% (-15,653 MT).
In contrast to NFDM/SMP, which has recorded only one month of YOY growth over the past year, U.S. low-protein whey has been up and down throughout 2025, buffeted mainly by pricing and tariff tensions. September was one of the down months. As noted above, volume fell by nearly 6,000 MT. Southeast Asia was responsible for the majority of that decline, with YOY volume to the region off by 37% (-4,552 MT) for the month.
U.S. low-protein exports fell 3% (-10,056 MT) YTD. (Note: USDEC has revised both low- and high-protein whey numbers to account for misclassified product shipped to China.)
For deeper dives into U.S. export performance in Mexico, Southeast Asia and Oceania, continue reading below after the charts.
All numbers have been adjusted for leap year. Whey volumes have been adjusted to account for misclassification of certain U.S. whey shipments to China.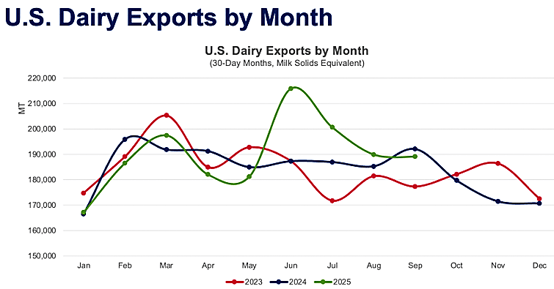
For more detailed information, as well as interactive charts and data, visit USDEC's Data Hub.
Cheese exports to Mexico soar, other products falter
After a tumultuous start to the year, U.S. cheese exports to Mexico jumped in September, notching the second-highest volume ever recorded to that market. Crucial gains were seen across several subcategories, including grated/shredded cheese (+26%, +1,563 MT). U.S. cheese exports to Mexico are on track to reach a record high this year if exports in each of the remaining three months total 15,500 MT or more.Unfortunately, strong performance in the cheese arena was offset by weaker numbers across other products, which weighed heavily on the total figure. Notably, U.S. exports of milk powder across the southern border slumped to 28,901 MT (-17%, -6,035 MT)—a particularly disappointing result after volumes had perked up earlier in the year. Lactose shipments were also down 68% (-3,627 MT), extending the downward trend seen this year.
All told, U.S. dairy exports to Mexico in milk solids terms fell 10% (-5,549 MT MSE) in September. Mexico’s economy has remained under pressure this year, particularly as elevated inflation has tested consumers and remittances have fallen by 5.5%. Looking ahead to 2026, though political challenges remain rife, the economy is expected to stabilize, which should boost consumption and reinvigorate Mexican demand for U.S. products.
Exports to Southeast Asia lag
For the fourth month in a row, U.S. exports to Southeast Asia trailed prior year levels, and the gap is widening. U.S. shippers sent 31,236 MT MSE of product into the region during September, 20% less (-7,568 MT) than during the same month last year. Dramatically lower exports of NFDM/SMP (-21%, -3,363 MT), low-protein whey (-38%, -4,772 MT), and lactose (-31%, -2,574 MT) weighed the most heavily on the overall total. Even though exports of buttermilk powder (+160%, +1,728 MT), WPC80+ (+93%, +473 MT), and cheese (+25%, +430) were stronger for the month, this was insufficient to compensate for losses in the other categories.A decline in exportable supplies of milk powder from the U.S. combined with tepid demand from SEA has caused volumes into the region to fall. In September, the most dramatic decline in absolute terms was borne by the Philippines where exports tumbled by 20% (-1,410 MT). However, similarly relevant drops were also seen into Vietnam (-53%, -655 MT) and Singapore (-80%, -1,006 MT), although the latter was against particularly strong volume in September 2024.
Milk powder wasn’t the only product to falter in September, as low-protein whey fell to the lowest volume seen since January. A strong prior-year total accentuated the loss even further. Indonesia was the main culprit for the weak performance as exports plummeted 68% (-3,755 MT) due especially to lower shipments of whey permeate (-85%, -1,791 MT)—which suggests weakness in the country’s livestock sector—and whey protein concentrate with less than 80% protein (-60%, -1,213 MT). Results were choppier across the remaining countries in the region with volumes down in the Philippines (-60%, -1,526 MT) and Thailand (-44%, -417 MT) while rising in Malaysia (+331%, +976 MT).
SEA remains a critical region for U.S. dairy exports, but with U.S. production increasingly oriented away from NFDM/SMP and dry whey, having product available to meet this need could pose a challenge over the coming months.
Opportunity blooms in Oceania
Oceania has been an unexpected bright spot for U.S. dairy exports this year. Typically, the region is not a major destination for American product given the proximity and presence of other global competitors. But buyers have been sourcing more from the U.S., thanks especially to competitive pricing for several dairy products through most of the year.U.S. dairy exports to Australia jumped 139% (+3,491 MT MSE) in September, driven by a surge in cheese and butter exports. Cheese shipments more than doubled for the month (+117%, +2,966 MT), adding to the momentum gained through the last several months. Driven by a shortage of cream and fat in the country, Australia has also been sourcing greater volumes of U.S. butterfat. In September, U.S. exports of butter and AMF grew from virtually zero to 1,280 MT, as Australia has emerged as the United States’ fourth largest butter market. With Australian demand expanding and the U.S. retaining its competitive price position, further growth to the market is anticipated.
U.S. exports have also been growing on the other side of the Tasman, as a strong milk production season in New Zealand has necessitated strong lactose purchases for standardization (+32% YTD, +12,841 MT). Impressively, the U.S. has also increased its cheese exports to the country, with volumes gaining 79% in September – albeit on very small volumes (+238 MT).
Overall, even as New Zealand imports are likely to be limited to lactose, Australia is emerging as an increasingly important market for U.S. dairy, as our product portfolio expands upon a strong foundation of cheddar for further processing and into natural cheese varieties, proteins and, more recently, butter.
Learn more about global dairy markets-
August exports continue growth streak, rise 3%
-
July marks second straight month of strong U.S. dairy exports
-
U.S. dairy exports surge in June
-
U.S. exports slip 2% in May
Subscribe to the U.S. Dairy Exporter Blog
The U.S. Dairy Export Council fosters collaborative industry partnerships with processors, trading companies and others to enhance global demand for U.S. dairy products and ingredients. USDEC is primarily supported by Dairy Management Inc. through the dairy farmer checkoff. How to republish this post.
-
