.png)

-
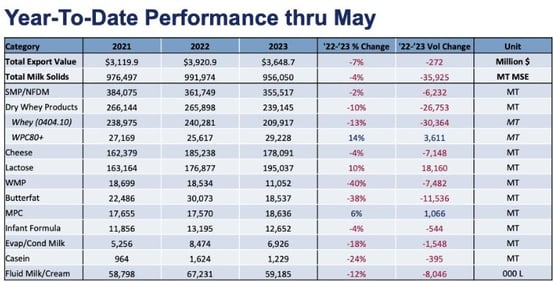
WPC80+ is the sole product category to grow in May as year-over-year MSE export volume slips 13%.
Last month, we laid out the key reasons why U.S. dairy exports were liable to struggle through the middle part of the year. As we examine May’s data, that analysis still holds true, as exports declined for the third straight month. U.S. dairy exports dropped 13%, the equivalent of 29,296 metric tons (MT) milk solids equivalent (MSE), as nearly all products fell below prior-year levels.
Cheese continued to struggle, declining 18% (-7,494 MT) – reflecting the uncompetitive prices that persisted for much of the fourth quarter of last year and into the first quarter of 2023 – as did low-protein whey exports (-29%, -15,950 MT). Positively, nonfat dry milk/skim milk powder (NFDM/SMP) held close to even (-3%, -2,221 MT) and WPC80+ trade increased sharply (+17%, +945 MT).
As always, we recommend against overemphasizing one month’s worth of results and remind readers of the lagging nature of trade data. Instead, we should focus on what the data tells us about market conditions and opportunities moving forward. Ultimately, the data reflects the saturated condition of the global dairy market as economic headwinds dent demand in Asia and the United States’ global competitors maximize the benefit of improved supply. But positively, Latin America remains a beacon of hope, with Mexico in particular continuing to impress.
Looking ahead, U.S. prices, particularly for cheese and proteins, have been much more competitive internationally (at least on a spot basis) and affordable to global consumers recently compared to earlier in the year. This should boost U.S. exports in the third quarter, but with the demand headwinds in Asia likely to remain through the end of the year, we expect limited upside for U.S. dairy exports until economic conditions improve or competitors’ milk production slows down.
.jpg?width=554&height=296&name=Chart2%20for%20May%20trade%20stats%20(3).jpg)
For more detailed information, as well as interactive charts and data, visit USDEC's Data Hub
Cheese sales remain slow
U.S. cheese exports fell 18% (-7,494 MT) to 33,149 MT in May. It was the largest year-over-year volume decline since the summer of 2015, when the Russian embargo on EU cheese led to EU suppliers shifting their focus to burgeoning U.S. export markets.
The U.S. posted significant drops to its two largest cheese markets in Asia—South Korea (-59%, -4,408 MT) and Japan (-44%, -2,347 MT)—and a 40% decrease in volume (-1,169 MT) to the Middle East/North Africa. Those three markets remain some of the most highly competitive in the world with U.S., European and Oceania suppliers all aggressively vying for market share.
On the positive side, U.S. suppliers continued their strong start to the year in Mexico. Year-over-year cheese sales jumped +21% (+1,960 MT) in May and were up 15% (+7,302 MT) year-to-date. May’s gain came almost entirely due to a 142% increase (+2,743 MT) in shipments of grated/powdered cheese.
While the cheese export growth trend continued in Mexico, May dented the strong start to the year in the rest of Latin America. U.S. volume to Central America fell 27% (-1,240 MT), due almost entirely to a 63% reduction in shipments to Panama. Cheese sales to South America were flat for the month, while sales to the Caribbean slipped 4% (-75 MT). However, even with the small regression, year-to-date U.S. cheese sales remain up to Central America (+11%), South America (+9%) and the Caribbean (+4%).
The May decline aligns with headwinds noted in last month’s trade data analysis: the shift in product mix in New Zealand toward cheese (and SMP), increased cheese supply out of Europe, and overall dampened global consumer demand.
Moving forward, inflation and lackluster global economic growth are likely to continue to vex consumption. However, milk production growth in the EU is waning and New Zealand has entered its off-season. In addition, U.S. cheese sales could see at least a short-term boost from pricing trends.
-Jul-06-2023-08-53-51-5318-PM.jpg?width=554&height=284&name=Chart4%20(2)-Jul-06-2023-08-53-51-5318-PM.jpg)
After months of the U.S. losing sales to cheap European product, U.S. prices dropped sharply in late April, making the U.S. the least expensive spot cheese on the market since then. As a result, we should see improvement in U.S. cheese exports in upcoming trade data reports, particularly in those major markets in Asia. However, a sharp upward futures curve is likely to keep a rally limited to July and August until demand improves or the futures market aligns closer with international market conditions.
Divergence within whey complex
Switching gears to the whey complex, we are seeing some key trends emerge.
Starting on a positive note, U.S. high-protein whey exports are on a tear, climbing for eight straight months. Japan has emerged as the United States’ largest and most reliable WPC80+ market (+11%, +565 MT year-to-date after a record year in 2022), but Japan was not alone with widespread improvement globally, with particularly notable growth in shipments to China (+39%, +1,462 MT YTD), Brazil (+30%, +1,528 MT YTD) and Canada (+27%, +890 MT YTD).
Lower prices and an increase in available supplies for WPC80 and WPI are clearly helping support export growth. For context, export unit values for May 2023 averaged $3.50/lb. compared to $5.45/lb. the year prior. However, the high prices that persisted throughout 2022 have burned off demand in some critical markets that were launching new protein-fortified products, particularly in South Korea (-62%, -1,413 MT YTD) and Southeast Asia (-20%, -495 MT YTD).
.jpg?width=554&height=283&name=Chart3%20for%20May%20trade%20stats%20(3).jpg)
On the flip side, whey permeate demand is clearly lagging. Using the “modified whey, not elsewhere specified” code as a proxy for whey permeate, we saw the lowest monthly export volume in May since July 2020. In total, U.S. modified whey exports were halved in May (-51%, -11,276 MT) and lag 22% (-19,074 MT) through the first five months of the year.
Clearly, whey for feed demand within China has fallen in tandem with pork prices, which has been the primary driver of permeate exports. At the same time, dry whey prices have dropped to historic lows, incentivizing purchasing of sweet whey over permeate for feed rations, which is reflected by dry whey volumes holding up comparatively well (-2%, -396 MT in May).
Looking ahead, we anticipate high-protein whey exports to remain a bright spot for U.S. dairy exports. However, while there is plenty of permeate and dry whey available for international buyers at very affordable prices, persistently weaker demand within China for feed and economic headwinds in Southeast Asia denting whey-for-food use are likely to keep low-protein whey exports subdued in 2023.
Learn more about global dairy markets:
-
Weaker demand and increased competition dent U.S. dairy exports in April
-
U.S. dairy exports dip for first time in a year
-
U.S. dairy exports eke out another volume increase in February
-
U.S. dairy exports start strong in 2023
Subscribe to the U.S. Dairy Exporter Blog
The U.S. Dairy Export Council fosters collaborative industry partnerships with processors, trading companies and others to enhance global demand for U.S. dairy products and ingredients. USDEC is primarily supported by Dairy Management Inc. through the dairy farmer checkoff. How to republish this post.
-
