.png)

-
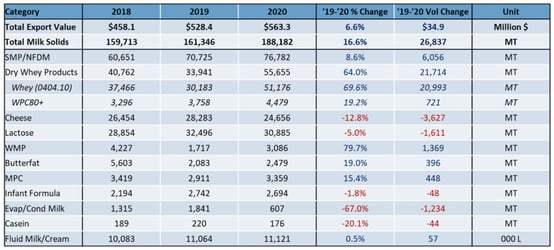
Powered by strong whey and NFDM/SMP sales to Asia-Pacific, U.S. dairy exports posted their 14th consecutive month of year-over-year gains in October.
Trade data shows aggregate sales of major products (milk powder, whey, cheese, butterfat, and lactose) increased by 14% to 201,902 metric tons. It was a record for October and the third time this year that U.S. suppliers topped the 200,000-MT mark in a single month.
Over the first 10 months of 2020, total U.S. exports grew 16% (milk solids equivalent), while value was up 12% to $5.54 billion. We remain on pace for a record volume year.
October in a nutshell: A big rebound in whey sales to China and strong sales of SMP to Southeast Asia were enough to offset reduced demand across categories in Mexico and slow U.S. cheese sales in most other regions.
Looking at the data, the three major trends we see are:
1. China drives record whey volumes
While we talked about China in last month’s summary, the sheer scale of U.S. whey exports bears repeating for October. U.S. volumes hit an all-time high at 55,655 MT of whey products. That was a 64% increase from October 2019 – an improvement of over 20,000 MT.
.jpg?width=554&name=October%20trade%20stats6%20(4).jpg)
China was far and away the primary driver of the growth, accounting for 48% of total U.S. whey exports in October. For much of the past year, we have talked about 2020 as a recovery year for whey following retaliatory tariffs placed on U.S. dairy going to China and African Swine Fever reducing demand in 2019. However, October volumes to China demonstrate that the market has moved from recovery to demand expansion.
October volumes to China were up 328% (+20,285 MT), which, while from a low 2019 base, was still 3% greater than the previous volume record to China in December 2017. Encouragingly, China was not alone – volumes to Southeast Asia were up 42% (+3,235 MT) thanks to substantial growth to Vietnam (+2,847 MT) and smaller gains in Indonesia, Philippines, Thailand, and Malaysia.
These improvements confirm market reports that increased export interest was a major driver of strengthening dry whey prices over the past couple of months. With prices still supported at the time of writing, this should indicate that volumes could keep up the momentum through Q4 and into early 2021.
As an aside, the growth in whey is not only driven by product for China’s feed market. Exports of WPC80+ grew for the 12th straight month. This continues the long-term growth trend for the product category. China was the largest export destination here too, but shipments of WPC80+ are more diversified with growth to Japan, Korea, Southeast Asia, and Europe, making up for the effective closing of the Indian market earlier this year.
2. Asia keeping NFDM/SMP market in balance
For NFDM/SMP, October was a similar story compared to previous months. October shipments posted another month of growth, up 9% (+6,056 MT), with a 20% expansion in volumes to Southeast Asia (+5,125 MT), making up for a 10% decline in volumes to Mexico (-3,195 MT).
A 5,000-MT gain in volumes to Southeast Asia (despite strong 2019 figures) signals robust demand for U.S. powder to the region. One piece to watch moving forward is which countries in the region grow. In October, the Philippines was the market driving growth (+137%, +7,611 MT) while others in the region were static or fell slightly in October. Determining whether this results from a change in market share, slower demand growth, or a combination of both will need to wait for the European Union’s data.
Still, aside from Southeast Asia, other volumes grew as well. SMP exports to China have proven sustainable after six straight months of greater-than-1,000-MT volumes. October exports to China came in at 3,833 MT compared to just 463 MT in October 2019. China was the largest destination for U.S. SMP after Southeast Asia and Mexico.
Ultimately, strong export volumes – particularly to Southeast Asia and China – have helped keep markets in balance, despite the substantial increase in milk production in October and weaker Mexican demand. While inventories climbed in October, they are far from burdensome, especially compared to March-April-May levels.
.jpg?width=554&name=October%20trade%20stats7%20(3).jpg)
.jpg?width=1&name=October%20trade%20stats7%20(3).jpg)
3. Uncompetitive prices trip up U.S. cheese exports
It was expected that record-high U.S. cheese prices would eventually catch up to U.S. cheese exports. October volume fell 13% to 24,646 MT, the lowest monthly volume since September 2018. U.S. exports put up a valiant fight during the first peak in U.S. cheese prices in the spring/summer (May-September cheese exports increased 13% compared to the same period the previous year), but the second price spike in summer/fall appears to have had an impact.
The biggest drop in October came from Mexico, where year-over-year cheese exports fell 46% (-4,135 MT). It was Mexico’s lowest monthly import volume in more than seven years. A struggling economy and pandemic fallout on foodservice continue to weigh on demand.
And Mexico wasn’t alone: We also saw a weakening in U.S. cheese sales to Southeast Asia (-13%), Central America (-8%), the Middle East (-6%), Australia (-21%), and the Caribbean (-13%).
On the positive side, U.S. cheese shipments to South Korea (+21%), Japan (+44%), and Chile (+52%) recorded gains, but it not enough to compensate for the decline to Mexico.
U.S. cheese prices have also come back to earth over the last month, putting us back in a competitive range with Oceania and the EU, but there may be more months similar to October until recent sales are shipped.
.jpg?width=554&name=October%20trade%20stats8%20(3).jpg)
More information, data and charts on specific products and markets can be found here.
Learn more about global dairy markets:-
U.S. dairy exports rise for 13th consecutive month
-
U.S. dairy year-to-date exports up 16%
- September's Dairy Data Dashboard
-
U.S. dairy export volume up 16% through July
Subscribe to the U.S. Dairy Exporter Blog
The U.S. Dairy Export Council fosters collaborative industry partnerships with processors, trading companies and others to enhance global demand for U.S. dairy products and ingredients. USDEC is primarily supported by Dairy Management Inc. through the dairy farmer checkoff. How to republish this post.
-
