-
Third-quarter MSE export volume was largest ever.
Year-over-year (YOY) U.S. dairy exports increased 10% on a milk solids equivalent (MSE) basis in September, as robust global demand continued to fuel trade. The increase lifted year-to-date (YTD) growth one-half point to just over +7%, keeping volume on a record pace for the year with only a quarter remaining.
Export value this year has been even more impressive. September marked the first time U.S. suppliers shipped more than $1 billion worth of dairy products in a single month. September value surged 29%, lifting YTD value to $8.18 billion and all but guaranteeing the full-year total will exceed $10 billion for the first time.
On a quarterly basis, July-September 2026 was the best third quarter in history for the United States. MSE volume and U.S. dairy export value topped the former high from July-September 2022—narrowly in the case of MSE volume, handily in terms of value.
Read on to learn more about a few key areas we’ve been watching.
Even with the backdrop of war, exports to the Middle East rise
Trade data through the first three quarters showed that while ongoing hostilities in the Middle East created headwinds for U.S. dairy exports to the region, they failed to halt cheese and butterfat shipments (our top two products in the Middle East) or deter overall U.S. export growth.
U.S. butterfat exports to the Middle East increased 381% in the first quarter (which included the first month of fighting and the initial closure of the Strait of Hormuz), 330% in the second quarter, and 46% in the third quarter—all healthy gains. U.S. cheese exports to the Middle East fell 26% in Q1 (including 21% in the first two months, before supply chain issues became a problem), prior to rising 19% in Q2 and 5% in Q3.
While those topline numbers are fairly strong, they hide the supply chain gymnastics required to continue shipping to the region.
U.S. cheese and butterfat exports to Bahrain and the UAE stalled with the onset of hostilities. Aggregate U.S. cheese shipments to the UAE and Bahrain fell a combined 70% (-4,084 MT MT) in the second and third quarters. But those sales were not completely lost, as product was rerouted through other regions, primarily Saudi Arabia, where U.S. exports grew 91% (+5,553 MT) and offset the decline.
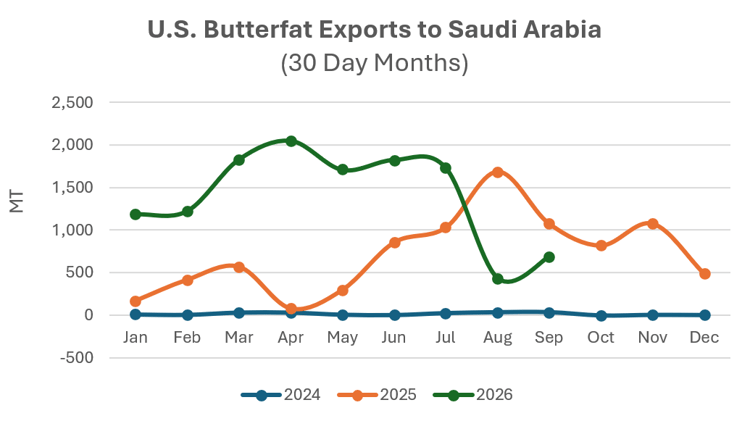
The impact on butterfat was a little different. Bahrain was transforming into a burgeoning market for U.S. butterfat at the start of the war. For the five months through February, the country was the No. 4 U.S. butterfat market, buying 5,181 MT of butterfat versus just over 27 MT the previous year. Then U.S. shipments fell to zero for the subsequent five months.
Like cheese, butterfat was rerouted through Saudi Arabia. U.S. butterfat exports to Saudi Arabia increased 222% (+6,428 MT) for the five months through July—the same months of zero shipments to Bahrain.
With some container ship traffic restarted through the Strait of Hormuz this summer, direct shipments to Bahrain resumed in Q3. U.S. suppliers exported 2,742 MT of butterfat to Bahrain in August and September, up from zero the prior year. The United States saw a commensurate YOY decline to Saudi Arabia in Q3: -63% (-2,528 MT).
The bottom line: Sellers and buyers have implemented supply chain workarounds, and in the end, it may not be supply chain challenges that limit U.S. dairy export growth to the region but the broader effects of the war. The International Monetary Fund, for example, projects GDP declines between -3% and -17% this year for countries bordering the Persian Gulf, with economic challenges further exacerbated by rising inflation.
Strong low-protein whey sales provide boost to U.S. dairy exports
Low protein whey has been a consistent bright spot for U.S. exports in 2026. Shipments under HS code 0404.10 trended steadily upward throughout the year, with stable demand from China providing a solid base and surging demand in other markets driving the gains. Over the first nine months of the year, U.S. exporters sent nearly 470,000 MT of low-protein whey abroad under the 0404.10 code, 20% more than during the same period last year. The dynamic is straightforward: global appetite for protein and co-products remains strong and buyers are looking for value.
China remains the largest buyer of U.S. low-protein whey, with exports up 10% (+16,732 MT) year-to-date. But much of that gain reflects dramatic year-over-year increases against weak comparisons in Q2 last year when fluctuating trade policy disrupted shipments, rather than a new wave of demand. Volumes have since stabilized and moved sideways for several months, making China an anchor for U.S. exports rather than the engine of growth.
The real momentum has come from other markets. After trailing 2025 volumes for most of the year, exports to Southeast Asia picked up significantly in the third quarter (+47%, +13,202 MT). With global high-protein whey prices at historical highs, importers may be seeking more affordable sources of protein in whatever form is available. The same dynamic likely applies in Japan (+98%, +3,050 MT) and Korea (+126%, +3,489 MT), where demand also surged in Q3.
Canada has also provided a burgeoning source of demand for whey protein concentrates shipped under Chapter 04. Exports have run well ahead of last year since January, accelerating sharply in the third quarter (+217%, +14,664 MT). Over the past three years, U.S. shipments to Canada typically ranged between 2,000 and 3,000 MT per month. Since January, volumes have consistently exceeded 5,000 MT monthly, topping 7,000 MT each month in Q3.
Looking ahead to the end of the year and into 2027, global demand for dairy ingredients should continue to support low-protein whey exports. While higher dry whey prices could burn off some of the more opportunistic sales, a diversified customer base across Asia and North America gives U.S. exporters more outlets and reduces the risk that a slowdown in any single market derails momentum.
Challenging outlook persists for milk powder
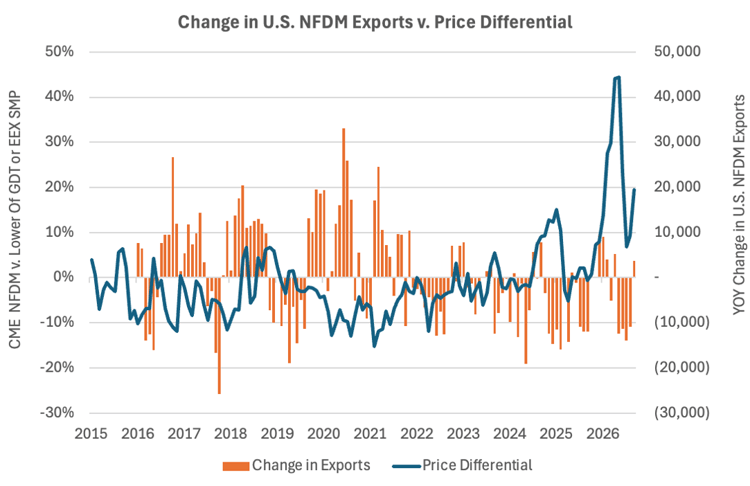
A victim of both tight supplies and uncompetitively high prices, U.S. milk powder shipments spent most of this year in the doldrums. While performance was mixed over the first third of the year, volumes moved decisively downward between May and August, when U.S. prices reached uncompetitively high levels compared to product from Europe and Oceania. Over the first nine months of the year, cumulative exports of nonfat dry milk (NFDM) fell 6% to just 467,000 MT, the lowest volume for the period since 2017.
U.S. milk powder shipments did demonstrate an encouraging bump in September (+7%, +3,677 MT). However, we believe that this was likely a temporary increase as buyers capitalized on the dip in prices over the summer, when values took a brief respite between their two rallies. Since then, prices have once again ascended, and despite appreciation in global quotes for SMP, U.S. prices remain uncompetitively high compared to global competitors.
Over the long term, the U.S. market must come back into step with global values. Approximately 70% of the milk powder produced in the U.S. is destined for the international market and domestic prices need to remain coherent with international values to avoid this critical outlet drying up. Milk powder is generally a commodity product with low switching costs for buyers, and the history has been clear that when U.S. prices get out of step with other suppliers, exports falter. But even greater price parity is likely to be sufficient to boost exports over the long term.
As demand for protein continues to pull skim solids away from the dryer and into other uses, supplies of milk powder are likely to remain restricted. With only a limited amount of product to allocate, we expect exporters will prioritize demand of domestic buyers and international buyers close to home, such as in Mexico and Central America. In fact, during Q3, while overall milk powder exports slipped by 13%, exports to Mexico actually grew by 4%.
This decision will have several consequences for the market. First, it means that exporters are likely to forego opportunities in other critical and competitive markets, such as Southeast Asia. Keen sellers from Europe and Oceania are likely to quickly occupy these commercial gaps. Second, it suggests that milk powder production will lean toward NFDM and away from skim milk powder (SMP). This dynamic is already playing out as year-to-date production of NFDM grew 10% while SMP output tumbled 21%.
Milk powder should remain a critical component of the U.S. export portfolio. But even if prices moderate, restricted supplies are likely to create a persistent headwind to export growth for the commodity.
Learn more about global dairy markets
- U.S. dairy export strong in September
- Women at the heart of Latin America's dairy sector
- U.S. dairy exports rebound in August
- U.S. dairy exports rise 9% in the first half
Subscribe to the U.S. Dairy Exporter Blog
The U.S. Dairy Export Council fosters collaborative industry partnerships with processors, trading companies and others to enhance global demand for U.S. dairy products and ingredients. USDEC is primarily supported by Dairy Management Inc. through the dairy farmer checkoff. How to republish this p