.png)

-
Widespread growth across categories leads to 14% surge in November U.S. dairy exports.
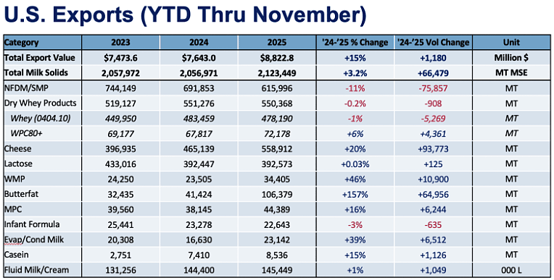
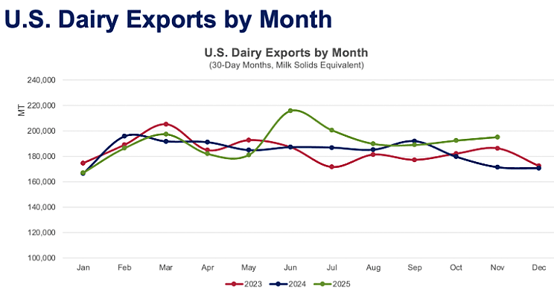
U.S. dairy export volume surged 14% year-over-year (YOY) in November in milk solids equivalent (MSE) terms. This year’s star growth categories—cheese and butterfat—continued to shine, accompanied by solid gains in low-protein whey, lactose, whole milk powder (WMP), and milk protein concentrate (MPC). The November increase put year-to-date MSE volume up 3.2% with one month left to tally.
YOY export value jumped 14% in November to US$801.7 million, making total U.S. dairy export value year to date $8.82 billion. When the government releases December data in three weeks, year-end 2026 U.S. dairy export value should be near the record of $9.66 billion set in 2022. (Note: The U.S. Census Bureau has been releasing trade data on a compressed scheduled as the government continues to catch up on months lost to last year’s shut-down.)
Favorable export conditions
U.S. dairy suppliers are in a strong position at the close of 2025/start of 2026. Ample supply, resilient international demand and favorable pricing converged to boost global dairy trade in the back half of last year, and the United States has been one of the beneficiaries. Global cheese demand is humming, and with U.S. milk production growth and manufacturing capacity expansion, U.S. cheese suppliers continue to capitalize. (For more information on global market dynamics, please check out USDEC’s International Demand Analysis.)YOY cheese export volume jumped 28% (+11,134 MT) in November to 50,775 MT. We’ve made the point before, but it bears repeating: U.S. cheese exports had never crossed 50,000 MT in a single month before 2025; November was the seventh consecutive month of greater-than-50,000 MT of U.S. cheese exports. Volume rose significantly to several geographies in November, including South Korea, which is poised to set an annual record for U.S. cheese purchasing (see below for deeper dive on South Korean cheese buying).
U.S. suppliers also continued to establish a larger role in global butterfat trade in November. YOY U.S. butter shipments soared 245% (+8,079 MT) while anhydrous milkfat/butter blends volume increased 184% (+2,549 MT). Five countries increased YOY volume by more than 1,000 MT in November and total butterfat exports were 15,308 MT—most ever in a single month. (For a deeper dive on U.S. butter business in the Middle East/North Africa (MENA) region, see below.)
Numbers rose across most major product categories, apart from nonfat dry milk/skim milk powder (NFDM/SMP) and high-protein whey (WPC80+):
- YOY low-protein whey exports grew 13% (+5,146 MT), led by a 28% increase to China (+5,124 MT), after USDEC analysts adjusted for misclassified products.
- Lactose shipments rebounded after two months of decline, as volume rose 5% (+1,614 MT). Gains to Indonesia (+1,810 MT) and Uruguay (+1,380 MT) helped offset declines to China (-1,808 MT).
- MPC continued its solid year, rising 52% (+1,329 MT) led by MENA (1,108 MT).
- WMP increased 43% (+1,193 MT). YTD, the category was up 46% (+10,819 MT), driven by MENA (+6,823 MT).
And while NFDM/SMP and WPC80+ didn’t record significant gains, they didn’t crash either. YOY NFDM/SMP volume was flat for the second straight month—a tolerable result given sizable, ongoing declines in U.S. SMP production. YOY WPC80+ slipped 3% (-211 MT) in November, with declines to Japan and China outweighing gains elsewhere.
For more detailed information, as well as interactive charts and data, visit USDEC's Data Hub.
Cheese booms in South Korea
South Korea has long been a critical destination for U.S. dairy exports, and especially for cheese. The Asian nation has held distinction as the second largest destination for U.S. cheese since 2008 and its importance was solidified in November when U.S. shipments rose by 3,674 MT (+136%), the largest increase seen across any market, by far. November’s result extends the growth streak seen over most of this year. With just one month of data outstanding, year-to-date cheese exports to South Korea were up 38% (+19,543 MT) to 71,177 MT—poised to eclipse the U.S. record of 75,789 MT set in 2022.Several other products also felt a bump during the month, including lactose (+32%, +263 MT) and modified whey (+451%, +701 MT), but cheese was the undisputed star. The vast majority of cheese the U.S. ships to Korea is mozzarella and cream cheese for foodservice use, classified under the fresh cheese tariff code (040610). Indeed, this category shouldered the bulk of the increase in cheese exports (+185%, +3,058 MT) during November, but other varieties also saw volumes grow. Exports of cheddar rose 56% (+165 MT), while the other cheese category grew 229% (+477 MT).
U.S. cheese shipments to South Korea have largely grown as a function of rising demand. In November, for example, total cheese trade to Korea grew by 3,938 MT, and nearly all of it (93%) came from U.S. suppliers. While competitive prices have increased the attractiveness of U.S. product, it is encouraging that rather than simply redistributing share, demand in the country is expanding—particularly considering economic challenges. South Korea’s GDP grew by just 1% in 2025, the lowest rate since the pandemic, with slower construction activity and political instability weighing heavily on economic performance.
It is encouraging that Korean cheese demand has persisted despite the trying economic environment, and more favorable days could be on the horizon as the central bank is projecting a GDP growth rebound to 1.8% this year. Overall, South Korea remains a cornerstone of U.S. trade and offers an important avenue for continued growth in cheese exports.
Milk powders support growth in Southeast Asia
After several months of sluggish exports to the region, U.S. dairy shipments to Southeast Asia grew 14% (4,545 MT) YOY in November, with particularly strong volumes to Indonesia (+58%, +3,401 MT), Malaysia (+40%, +1,153 MT), and Singapore (+75%, +1,391 MT). Growth in milk powder exports accounted for the bulk of this increase, with NFDM/SMP up 23% (+2,934 MT) and Indonesia posting the largest growth (+165%, +2,083 MT). In fact, November’s dramatic growth in milk powder exports to Southeast Asia, particularly Indonesia, offset losses in exports to Mexico, which fell 14% (-4,516 MT), and helped keep overall U.S. NFDM/SMP exports virtually flat despite the limited supply of milk powder available.Beyond milk powders, cheese exports to Southeast Asia grew 949 MT (+92%) in November, and lactose exports increased 20% (+1,201 MT). By contrast, exports of low-protein whey fell, with dry whey down 37% (-1,247 MT) and whey protein concentrate with less than 80% protein down 26% (-127 MT).
Looking at the year as a whole, despite a strong November, total U.S. exports to Southeast Asia still lag 2024 by 7% (-33,259 MT). Milk powder exports to the region have fallen 20% (-40,297 MT) over the same period, and whey exports (excluding WPC80+) fell 8% (-9,642 MT). Positively, this has been partially offset by gains in higher value products, namely cheese (+56%, +8,761 MT) and WPC80+ (+51%, +1,981 MT).
While much of this decline is due to a lack of export availability in milk powders from the U.S., reports indicate a slight decrease in GDP growth rates in some Southeast Asian economies as tariffs begin to take effect. However, with signed trade deals in Malaysia and Cambodia and others in negotiation, this effect may lessen as we move into 2026.
Demand surges in MENA
U.S. exports to the Middle East/North Africa (MENA) more than doubled in November (+136%, +5,555 MT MSE). Competitive pricing for several U.S. products has increased their attractiveness, despite the proximity of the EU to the region. This advantage gave U.S. suppliers an edge in November when demand surged as buyers prepared for an early Ramadan.U.S. exports of butterfat to MENA have been running hot for much of 2025 but accelerated in November to over 4,000 MT (monthly exports don’t typically surpass 1,000 MT). This month, MENA was second only to Canada as a destination for U.S. butterfat. Bahrain and Saudi Arabia drove much of the growth in demand, jumping from practically 0 MT in 2024 to 1,723 MT and 1,102 MT, respectively, in 2025. The price of U.S. butter remains its most attractive quality at the moment for Middle East buyers, but it is notable that the region has been one of the more aggressive in sourcing from the U.S. Their apparent eagerness for U.S. product is likely driven by preexisting familiarity with U.S. butter, a general preference towards white butter, and Bahrain being a key processed cheese hub in the region.
To add to the diversity of product to the region, MENA was also the top buyer of U.S. MPC in November, surpassing Mexico after months of running a close second. MPC shipments to the region jumped to 25 times that of 2024 levels (+1,108 MT). Not to be forgotten, demand for cheese (+54%, +1,279 MT) and lactose (+239%, +598 MT) also contributed to the rise.
U.S. exports to MENA have been trending slowly downward in recent years. However, given the price advantage several U.S. products had for much of 2025, that trend has turned distinctly positive. MENA is typically a price-sensitive region; competitively priced U.S. product should continue to drive strength in exports to the region, though perhaps at a less impressive pace.
*In order to correct for reporting inconsistencies (made clear by suspiciously low high-protein whey prices to China) and provide a more realistic picture of product flows, USDEC adjusts official whey export data, aligning reported unit values with actual market prices. If you have any questions or would like more information, don’t hesitate to reach out to any member of the Economics team.
Learn more about global dairy markets-
October U.S. dairy exports jump 7%
- U.S. dairy export volume up 1.7% through three quarters
-
August exports continue growth streak, rise 3%
-
July marks second straight month of strong U.S. dairy exports
Subscribe to the U.S. Dairy Exporter Blog
The U.S. Dairy Export Council fosters collaborative industry partnerships with processors, trading companies and others to enhance global demand for U.S. dairy products and ingredients. USDEC is primarily supported by Dairy Management Inc. through the dairy farmer checkoff. How to republish this post.
