.png)

-
Graphics illustrate growth through global trade as Congress debates TPA.
As Congress considers legislation known as Trade Promotion Authority (TPA), we thought it would be a good time to put into a single blog post 10 charts, tables, graphs and images showing the positive economic impact of U.S. dairy exports.
Every U.S. free trade agreement to date has yielded positive results for U.S. Dairy. TPA would streamline the process for Congress and the president to work together to complete well-negotiated trade agreements.
Feel free to share these charts in emails, on your websites, in newsletters and on social media. On a PC, simply right-click on a chart and save. Please credit USDEC and add a link back to this post to showcase all 10 charts.
Tweet it: 10 charts shows what global trade has done for the U.S. dairy industry.
Here are the 10 charts, plus a bonus video, not necessarily in order of importance:
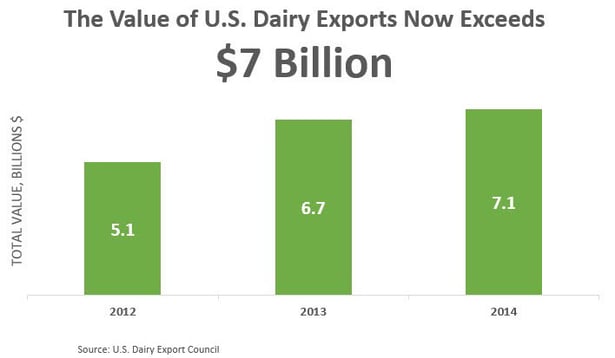
1: The value of U.S. dairy exports exceeds $7 billion annually. It grew more than 6% in 2014 compared to 2013. When compared to 2012, the increase is even more dramatic—39%. Chart source: USDEC.
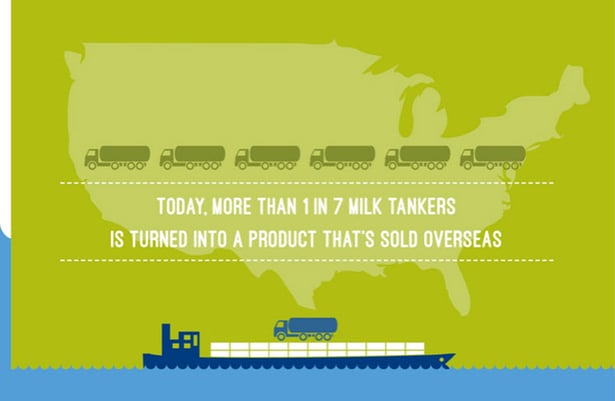
2: In 2014, exports were equivalent to 15.4% of U.S. milk production on a total milk solids basis. That's one out of seven milk tankers leaving American farms. Graphic source: USDEC.
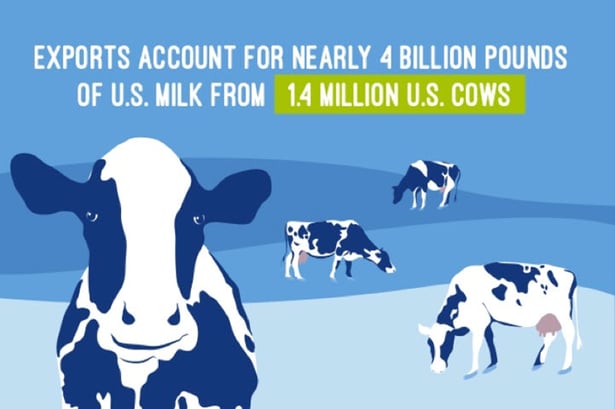
3: Exports now account for nearly 4 billion pounds of U.S. milk solids sold annually. That's more than all the milk produced in Wisconsin each year. Graphic: USDEC. See this in a video here.
4: Since implementation of the U.S.-Korea free trade agreement (KORUS) in 2012, U.S. dairy sales to South Korea have soared, reaching a high of $417 million last year. Chart source: USDEC.

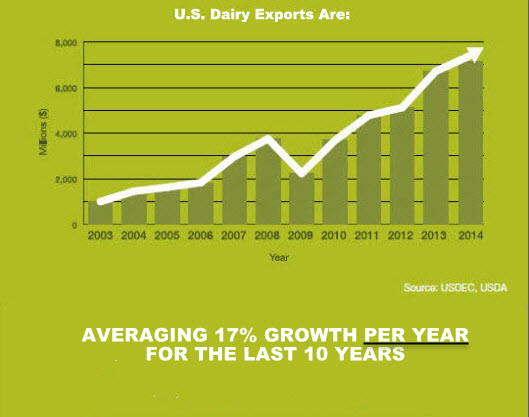
5: On a dollar-value basis, the growth in U.S. dairy exports over the last decade has averaged 17% per year. Chart source: USDEC.
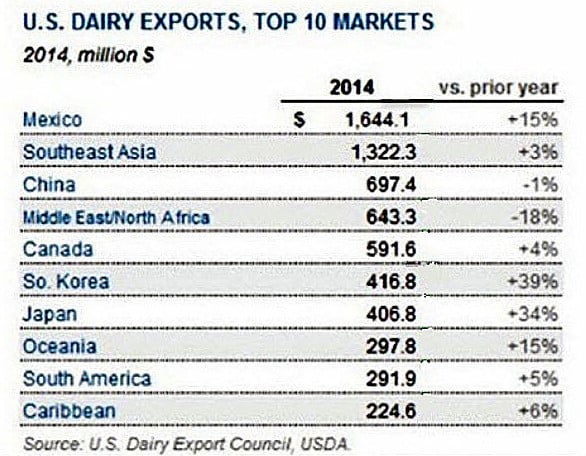
6: Thanks in part to the North American Free Trade Agreement (NAFTA), the United States sold more than $1.6 billion worth of dairy products to Mexico last year, making it our largest market. Table source: USDEC.
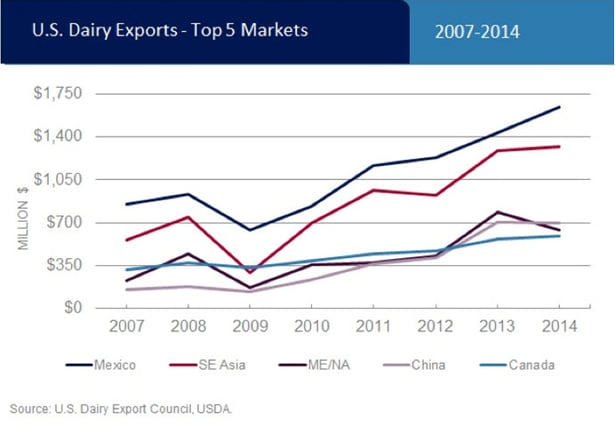
7: U.S. Dairy exports to Mexico, Southeast Asia, Middle East/North Africa, China and Canada have all increased significantly since 2007. Chart source: USDEC.
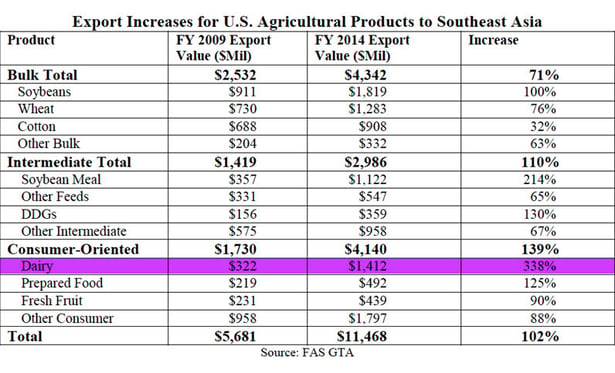
8: Dairy products had the highest percentage increase in value (338%) among U.S. agricultural products exported to Southeast Asia between fiscal year 2009 and 2014. Table: USDA.
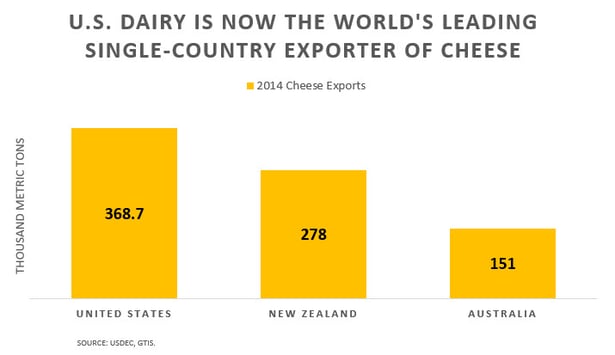
9: When it comes to exporting cheese, the United States is No. 1 by a large margin. Chart source: USDEC.
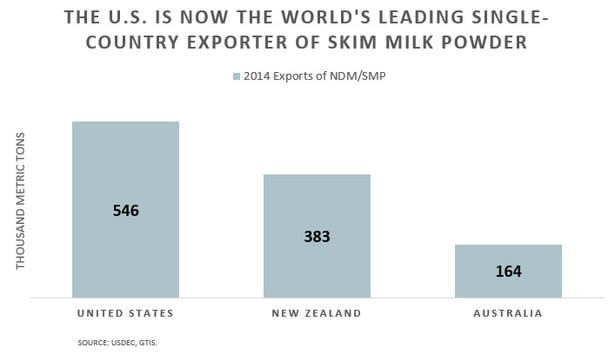
10: U.S. Dairy is No. 1 globally in exporting skim milk powder. In 2014, we exported 43% more skim milk powder than No. 2 New Zealand. Chart source: USDEC.
BONUS VIDEO: U.S. Dairy Exports: A Growth Story.
This video uses animated motion graphics and music to illustrate U.S. dairy export growth up to 2013. Click arrow below to watch.
.
The U.S. Dairy Export Council is primarily supported by Dairy Management Inc. through the dairy farmer checkoff that builds on collaborative industry partnerships with processors, trading companies and others to build global demand for U.S. dairy products
