.png)

-
NDM/SMP and lactose held up, but other products fell into a lower gear in 2015.
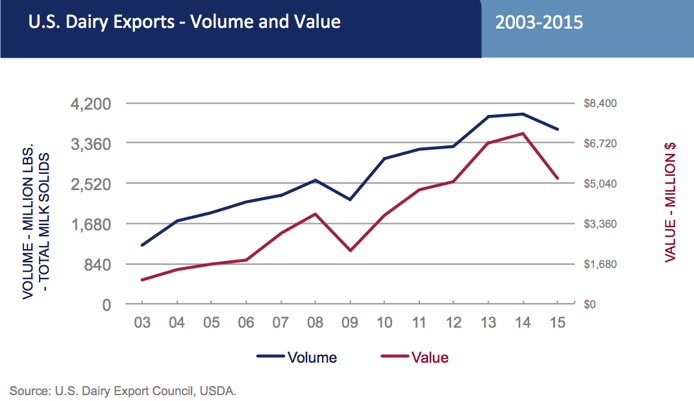
Trading into the weakest global dairy market in more than a decade, U.S. dairy exports declined in 2015, ending a streak of five straight years of expansion.
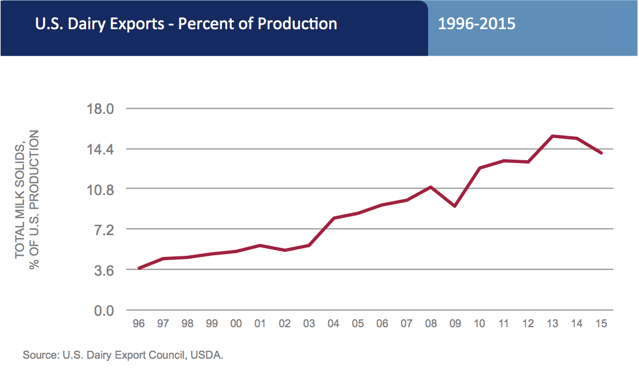
Dairy export sales totaled $5.24 billion last year, down 26 percent from 2014’s record level. Overall export volume was off 8 percent, at 3.645 billion lbs. of milk solids (total-solids basis). Export volume represented 14 percent of U.S. milk production in 2015, down from 15.3 percent in 2013-14.
A combination of factors came together to alter the supply-demand balance last year, creating a fierce competitive environment: China milk powder demand plunged; Russia banned dairy products from Europe; and milk supply in Europe grew dramatically when production quotas came off. Meanwhile, the West Coast port slowdown hampered U.S. sales early in the year, and strong domestic demand kept U.S. prices for cheese and butterfat above world-market values.
As a result, U.S. exporters lost share in key markets across Asia and the Middle East/North Africa region, across nearly all product segments. Instead, suppliers focused on sales of nonfat dry milk/skim milk powder (NDM/SMP) and cheese to Mexico, South America and the Caribbean.
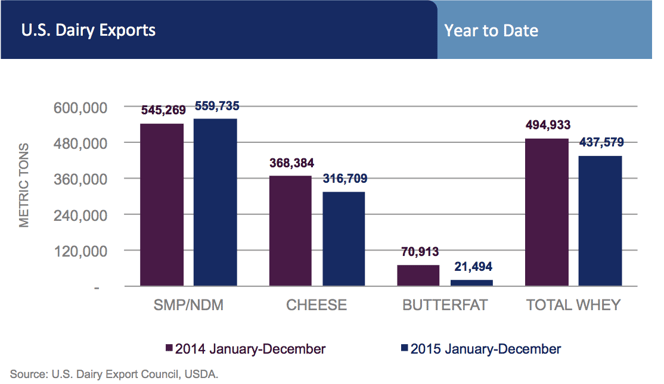
Total exports of NDM/SMP, in fact, reached a new high of 559,735 tons (1.23 billion lbs.) last year. Most other categories, however, fell into a lower gear.
“Over the last decade, the world marketplace for dairy has been primarily a buyers’ market, favorable for U.S. exporters. 2015 was more of a sellers’ market, and 2016 is shaping up to be more of the same,” says Tom Suber, president of the U.S. Dairy Export Council (USDEC). “U.S. suppliers have to understand that this may be the ‘new normal’ for a while, and they’ll need to be particularly aggressive to compete with exporters from Europe and Oceania.”
Longer-term, however, USDEC is confident that global dairy demand will again pressure available milk supplies. “This should bring both higher prices and a resumed export upside for U.S. suppliers,” Suber says.

This assessment is based on a new USDEC report, “2020 Global Demand Forecast for U.S. Dairy Exports,” which analyzed the fundamental supply and demand drivers for dairy to the end of the decade. The report concluded that the United States is still positioned to take advantage of the growth in global demand, but competitors, notably Europe, were also well positioned. Therefore, U.S. suppliers need to continue to improve on product specifications, customer service, marketing and supply-chain efficiencies.
Product-by-product details of U.S. export performance include:
- U.S. dairy exports in 2015 were valued at $5.24 billion. Even with the 2015 decline, exports have increased 15 percent annually over the last six years. The volume of exports was 3.6 billion lbs. of total milk solids, down 8 percent from 2014. In the last six years, export volume has increased 9 percent per year.
- U.S. dairy imports were unchanged in 2015 at $3.54 billion. On a volume (total solids) basis, imports increased 13 percent from 2014, to 930 million lbs. Export volume was nearly four times the level of imports.
- U.S. dairy export volume in 2015 (total milk solids) equated to 14 percent of U.S. milk solids production, down from 2013-14, when 15.3 percent of U.S. solids headed overseas. Exports represented 54.5 percent of the NDM/SMP produced in the United States last year, 40 percent of the dry whey, 6 percent of the cheese and 2.6 percent of the butter.
- Mexico remained the largest market for U.S. dairy exports, with sales of $1.28 billion last year. Other top markets were Southeast Asia ($853 million), Canada ($554 million), China ($450 million), South Korea ($306 million), South America ($281 million), Japan ($272 million) and the Middle East/North Africa region ($265 million).
- Exporters shipped 559,735 tons (1.23 billion lbs.) of nonfat dry milk/skim milk powder (NDM/SMP) last year, up 3 percent from 2014. Shipments of NDM/SMP to Mexico, the largest market for U.S. milk powder, were up 24 percent, and represented nearly half of U.S. shipments. New sales also were registered in Pakistan and Peru. But sales to other key destinations slipped. Exports to Southeast Asia decreased 11 percent, with a double-digit drop in shipments to Indonesia and a 9 percent decline to the Philippines. Significant decreases in export volumes were also noted to China and North Africa (primarily Algeria and Egypt).
- U.S. cheese exports dropped to 316,709 tons (698 million lbs. in 2015, down 14 percent from the prior year. U.S. sales to largest market Mexico were up 10 percent, but suppliers lost ground in South Korea (-20 percent), Japan (-39 percent) and Middle East/North Africa region (-40 percent).
- U.S. exports of whey proteins in 2015 were 437,579 tons (965 million lbs.), down 12 percent from the year before and the smallest volume since 2009. Exports of sweet whey dropped 22 percent to 178,963 tons (395 million lbs.), an 11-year low. Sales of whey protein concentrate (WPC) and other modified whey proteins slipped 6 percent to 222,373 tons (490 million lbs.). On a positive note, exports of whey protein isolate (WPI) jumped 26 percent to 36,244 tons (80 million lbs.).
- Shipments of whey proteins to China, our largest market, dropped 13 percent last year. Exports to Southeast Asia were down 7 percent and shipments to Mexico were down 30 percent.
- U.S. lactose exports were 360,176 tons (794 million lbs.), up 5 percent from a year earlier. Major markets remained Southeast Asia, China and New Zealand.
- Shipments of butterfat plunged (-70 percent), to just 21,494 tons (47 million lbs.), the lowest figure since 2006. In 2015, U.S. shipments to the Middle East/North Africa region – which have accounted for more than half of U.S. butterfat exports in recent years – were down 80 percent.
- Exports of fluid milk decreased 2 percent in 2015, to 89 million liters (202 million lbs.). Shipments to Canada and Mexico dropped 19 percent and 21 percent, respectively, but this was offset by big gains in sales to Taiwan and the Caribbean.
- Ice cream exports dropped 8 percent to 59,646 tons (132 million lbs.). Exports to Mexico, our primary market, decreased by 30 percent.
- Exports of other dry ingredients were mostly lower. Sales of whole milk powder were just 33,787 tons (74 million lbs.), down 38 percent, and exports of milk protein concentrate were merely 30,885 tons (68 million lbs.), down 41 percent. Meanwhile, shipments of food preparations and blends increased 2 percent to 65,167 tons (144 million lbs.)
- Global Dairy Markets May not Fully Rebound Until 2017
- 7 Reasons a Global Dairy Recovery not Imminent
- Three Pieces of a Global Dairy Turnaround
- What Will It Take to Turn Dairy Markets Around?
Subscribe to the U.S. Dairy Exporter Blog
The U.S. Dairy Export Council fosters collaborative industry partnerships with processors, trading companies and others to enhance global demand for U.S. dairy products and ingredients. USDEC is primarily supported by Dairy Management Inc. through the dairy farmer checkoff. How to republish this post.
